
Silver Market's Industrial Narrative Hits a Data Wall

Key Points
- A historic GSR shock emerges, boosting market attention
- This signal indicates a poor entry point, with silver's median January return at -4.1%
- Only when the "fund accumulation confirmation" signal appears does the market sustain gains
- "Physical lock-in" signal: Short-term rally followed by pullback, long-term returns remain uncertain
A Perfect Narrative Meets a Contradictory Signal
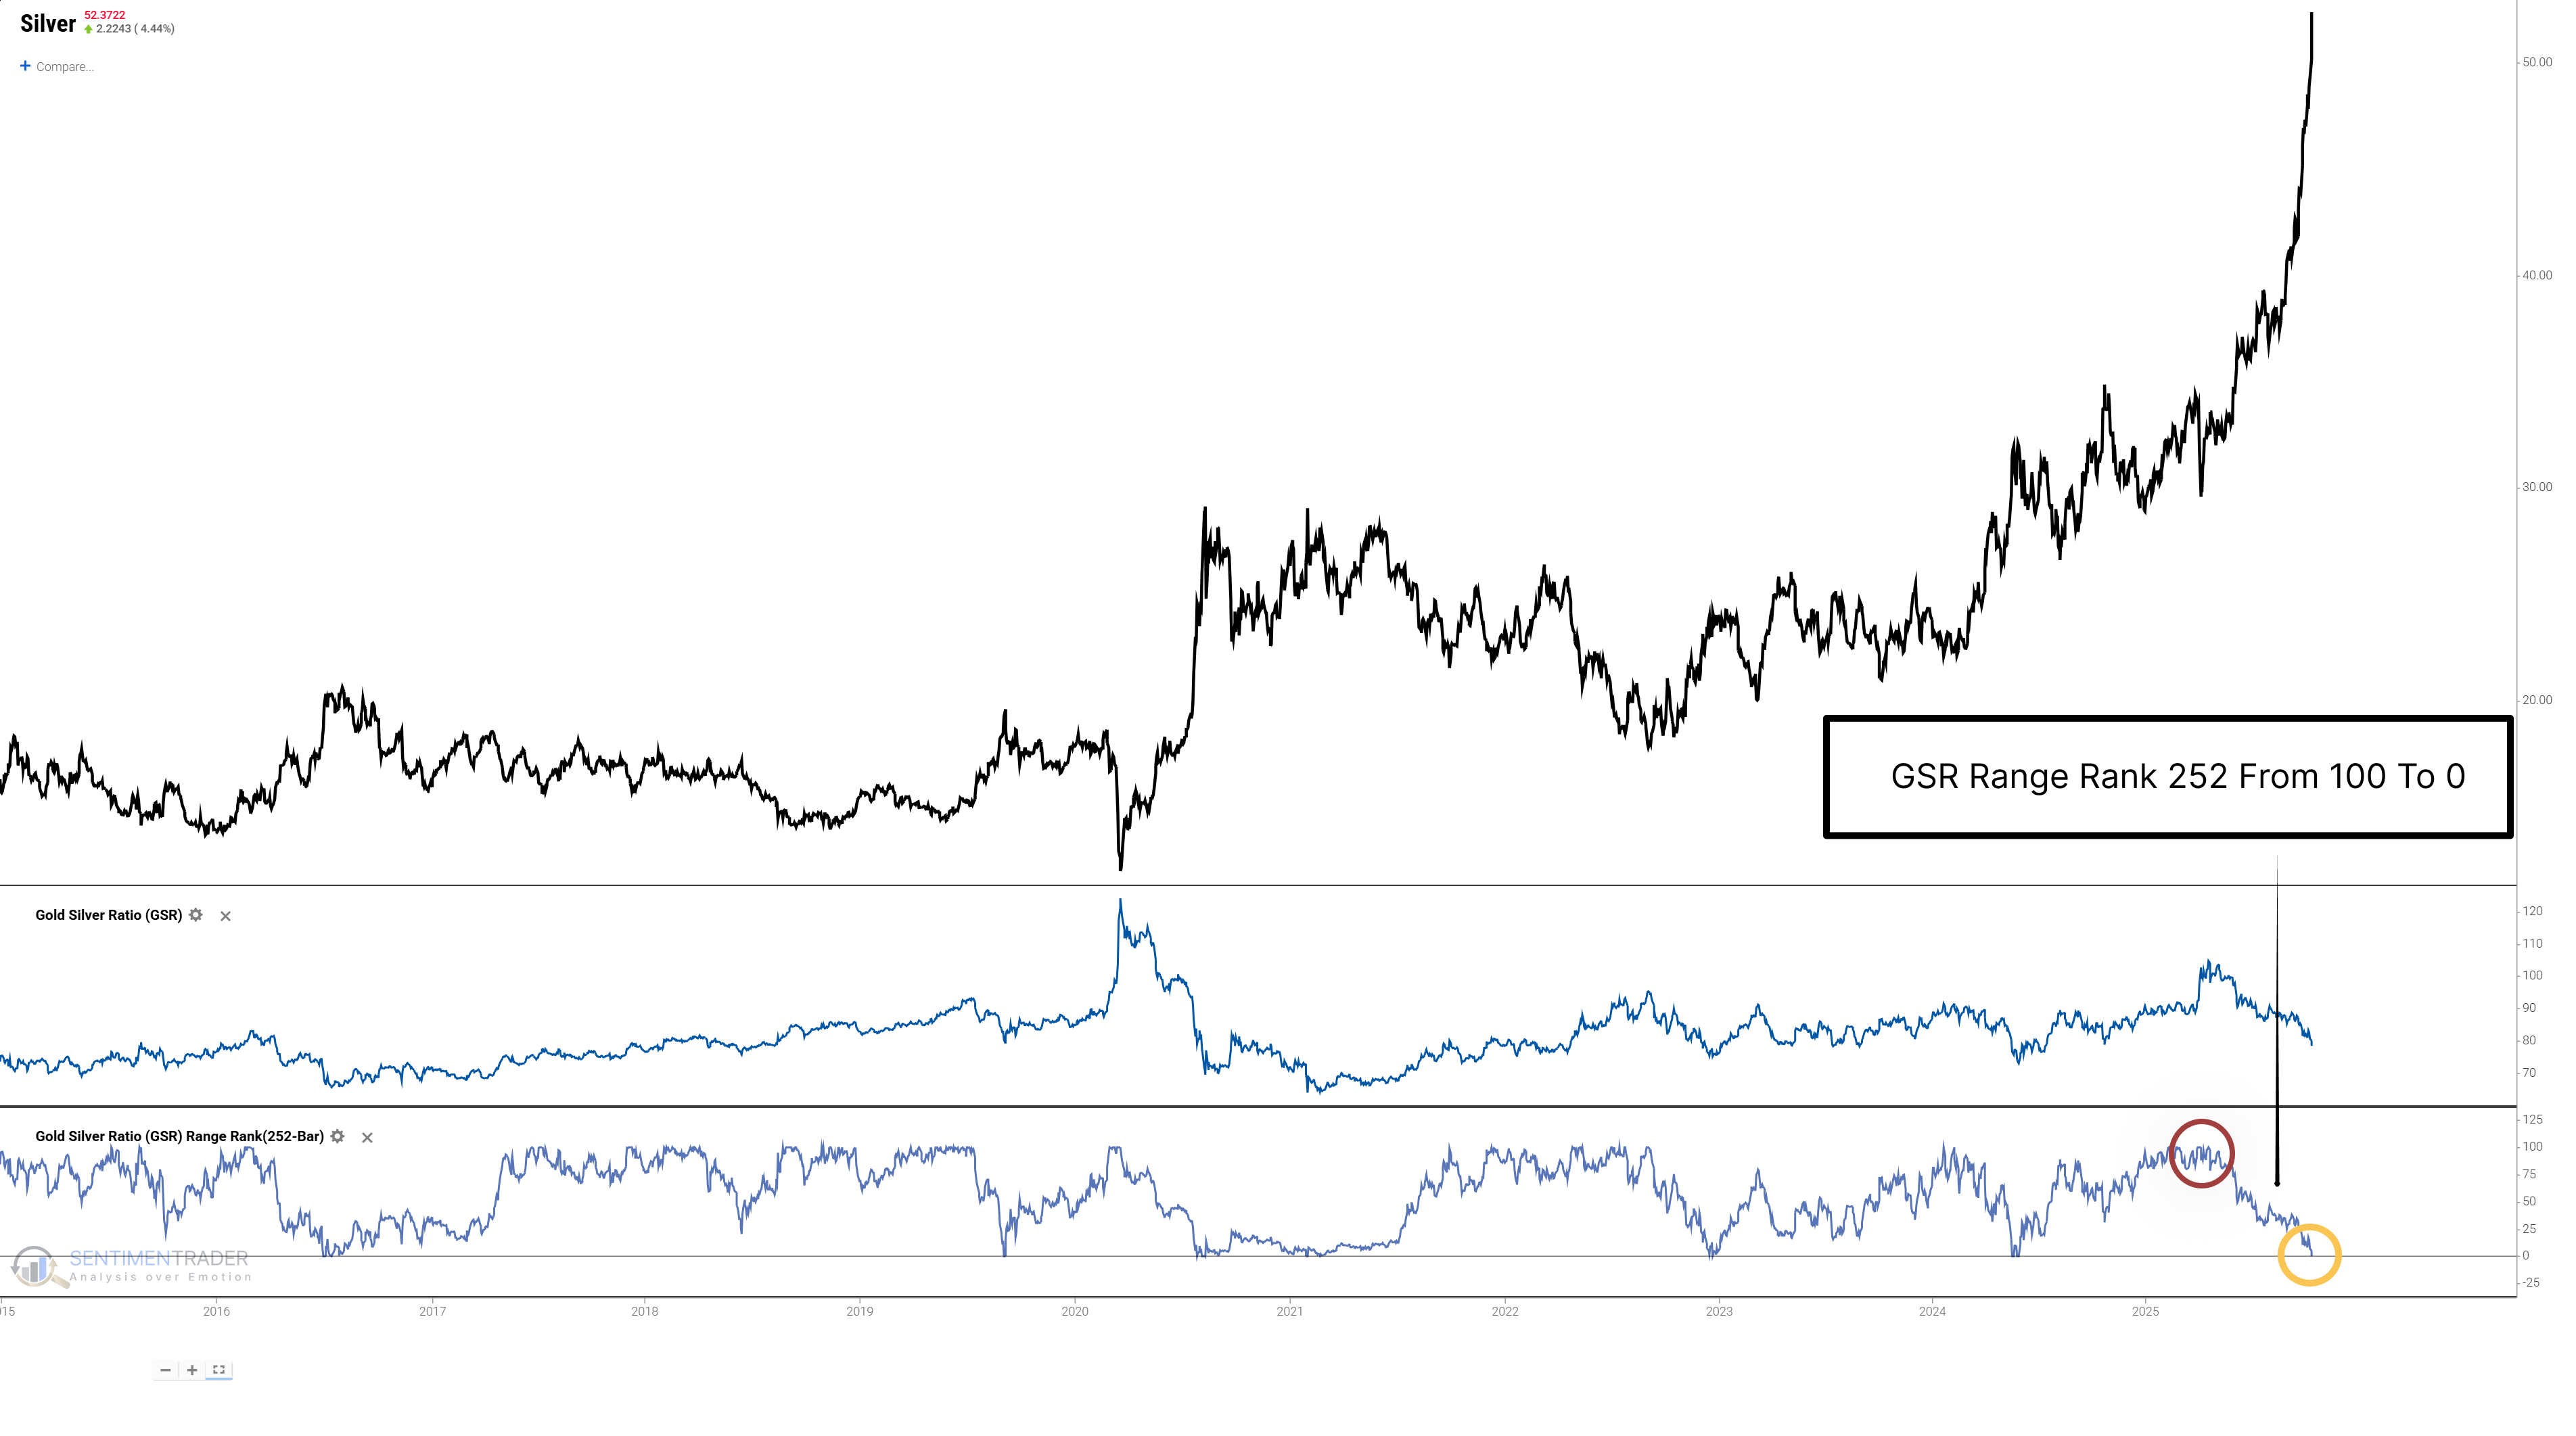
The Gold-to-Silver Ratio (GSR) - a key "barometer" for measuring the relative value of the two precious metals - has just sent a rare, historic signal. On October 13, 2025, the ratio collapsed sharply, with its 252-day rank plummeting from 100 (yearly high) to 0 (yearly low) in less than 126 days. This "GSR Shock" is not an ordinary market fluctuation, but an anomaly marking a dramatic, rapid revaluation of value between the two metals.
On one hand, the market holds a near-consensus grand narrative expectation for silver. Combined with explosive demand, constrained supply, and inventories at historically low levels, these factors collectively underpin the widespread belief in a "silver super cycle."
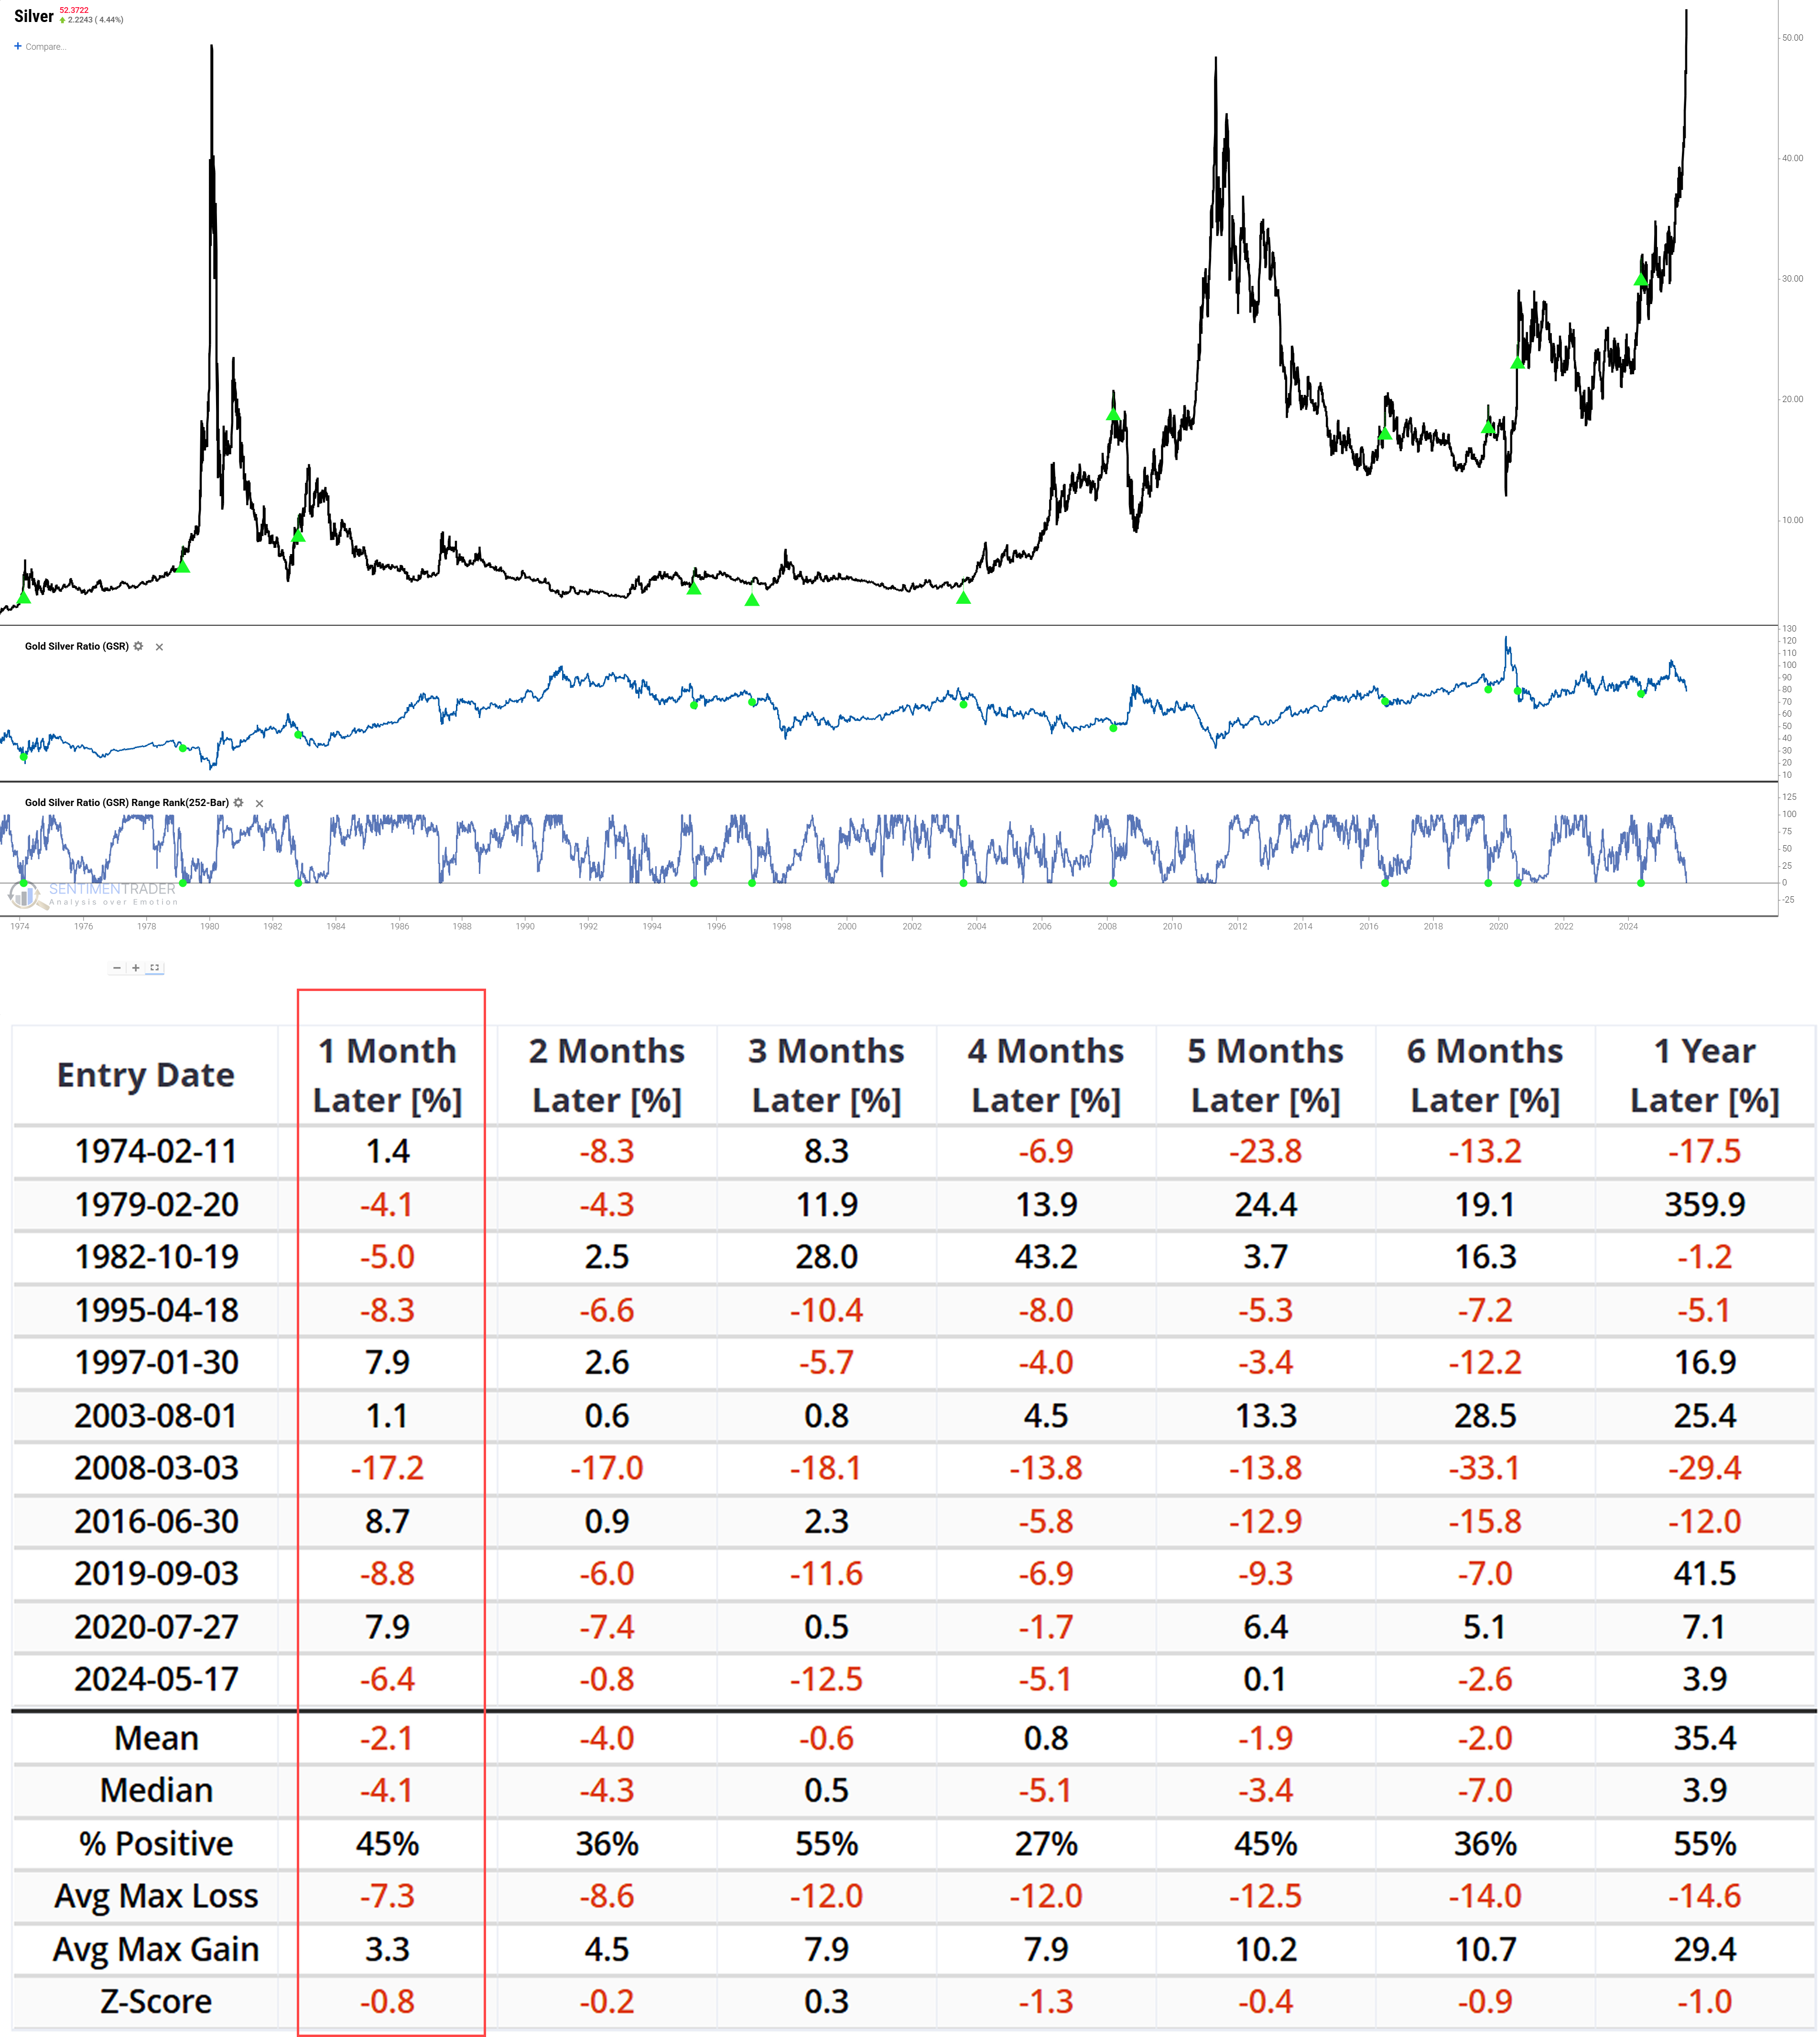
Beneath this optimism, however, historical data poses a severe challenge. The initial signal that ignited market enthusiasm - historically, has not been followed by sustained market rallies. Our backtest data shows that one month after this signal is triggered, the median return for silver is -4.1%, with only a 45% probability of positive returns.Related Backtest Click Here.
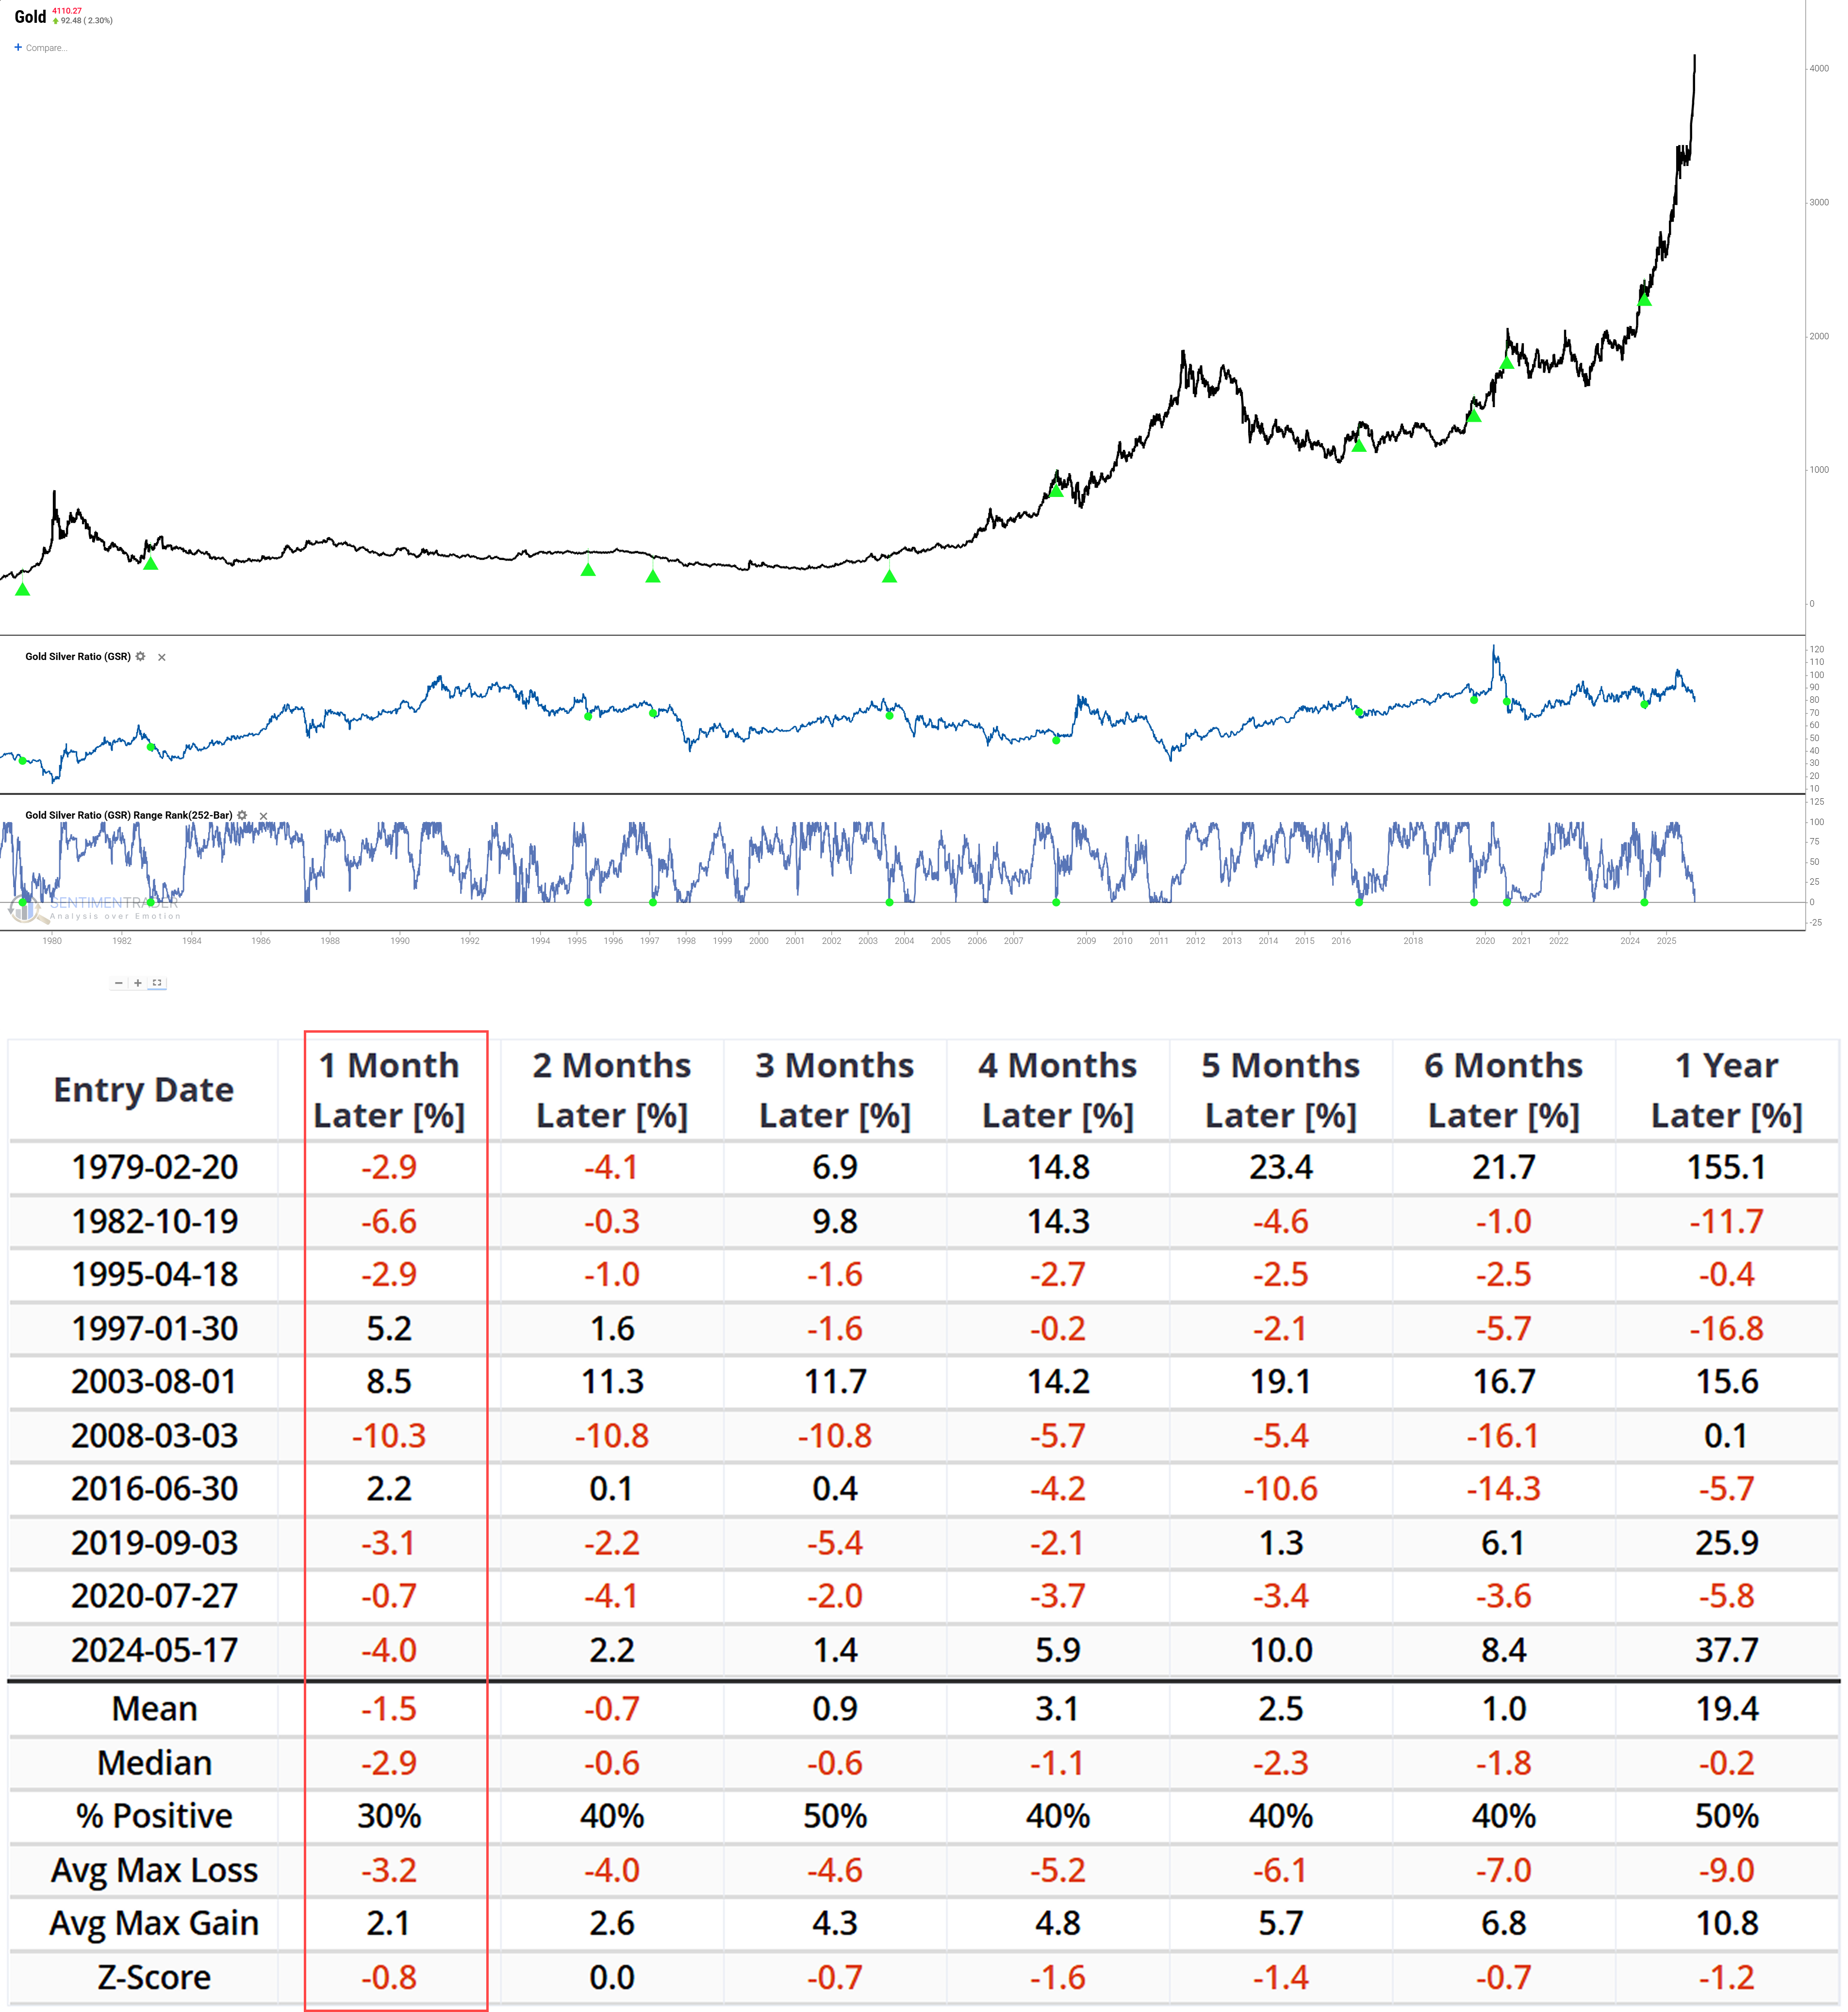
Even gold, which belongs to the same precious metals sector, showed weak short-term performance, with a median 1-month return of -2.9%. This data further confirms that a "GSR Shock" is actually a bearish signal for the entire precious metals sector in the short term.Related Backtest Click Here.
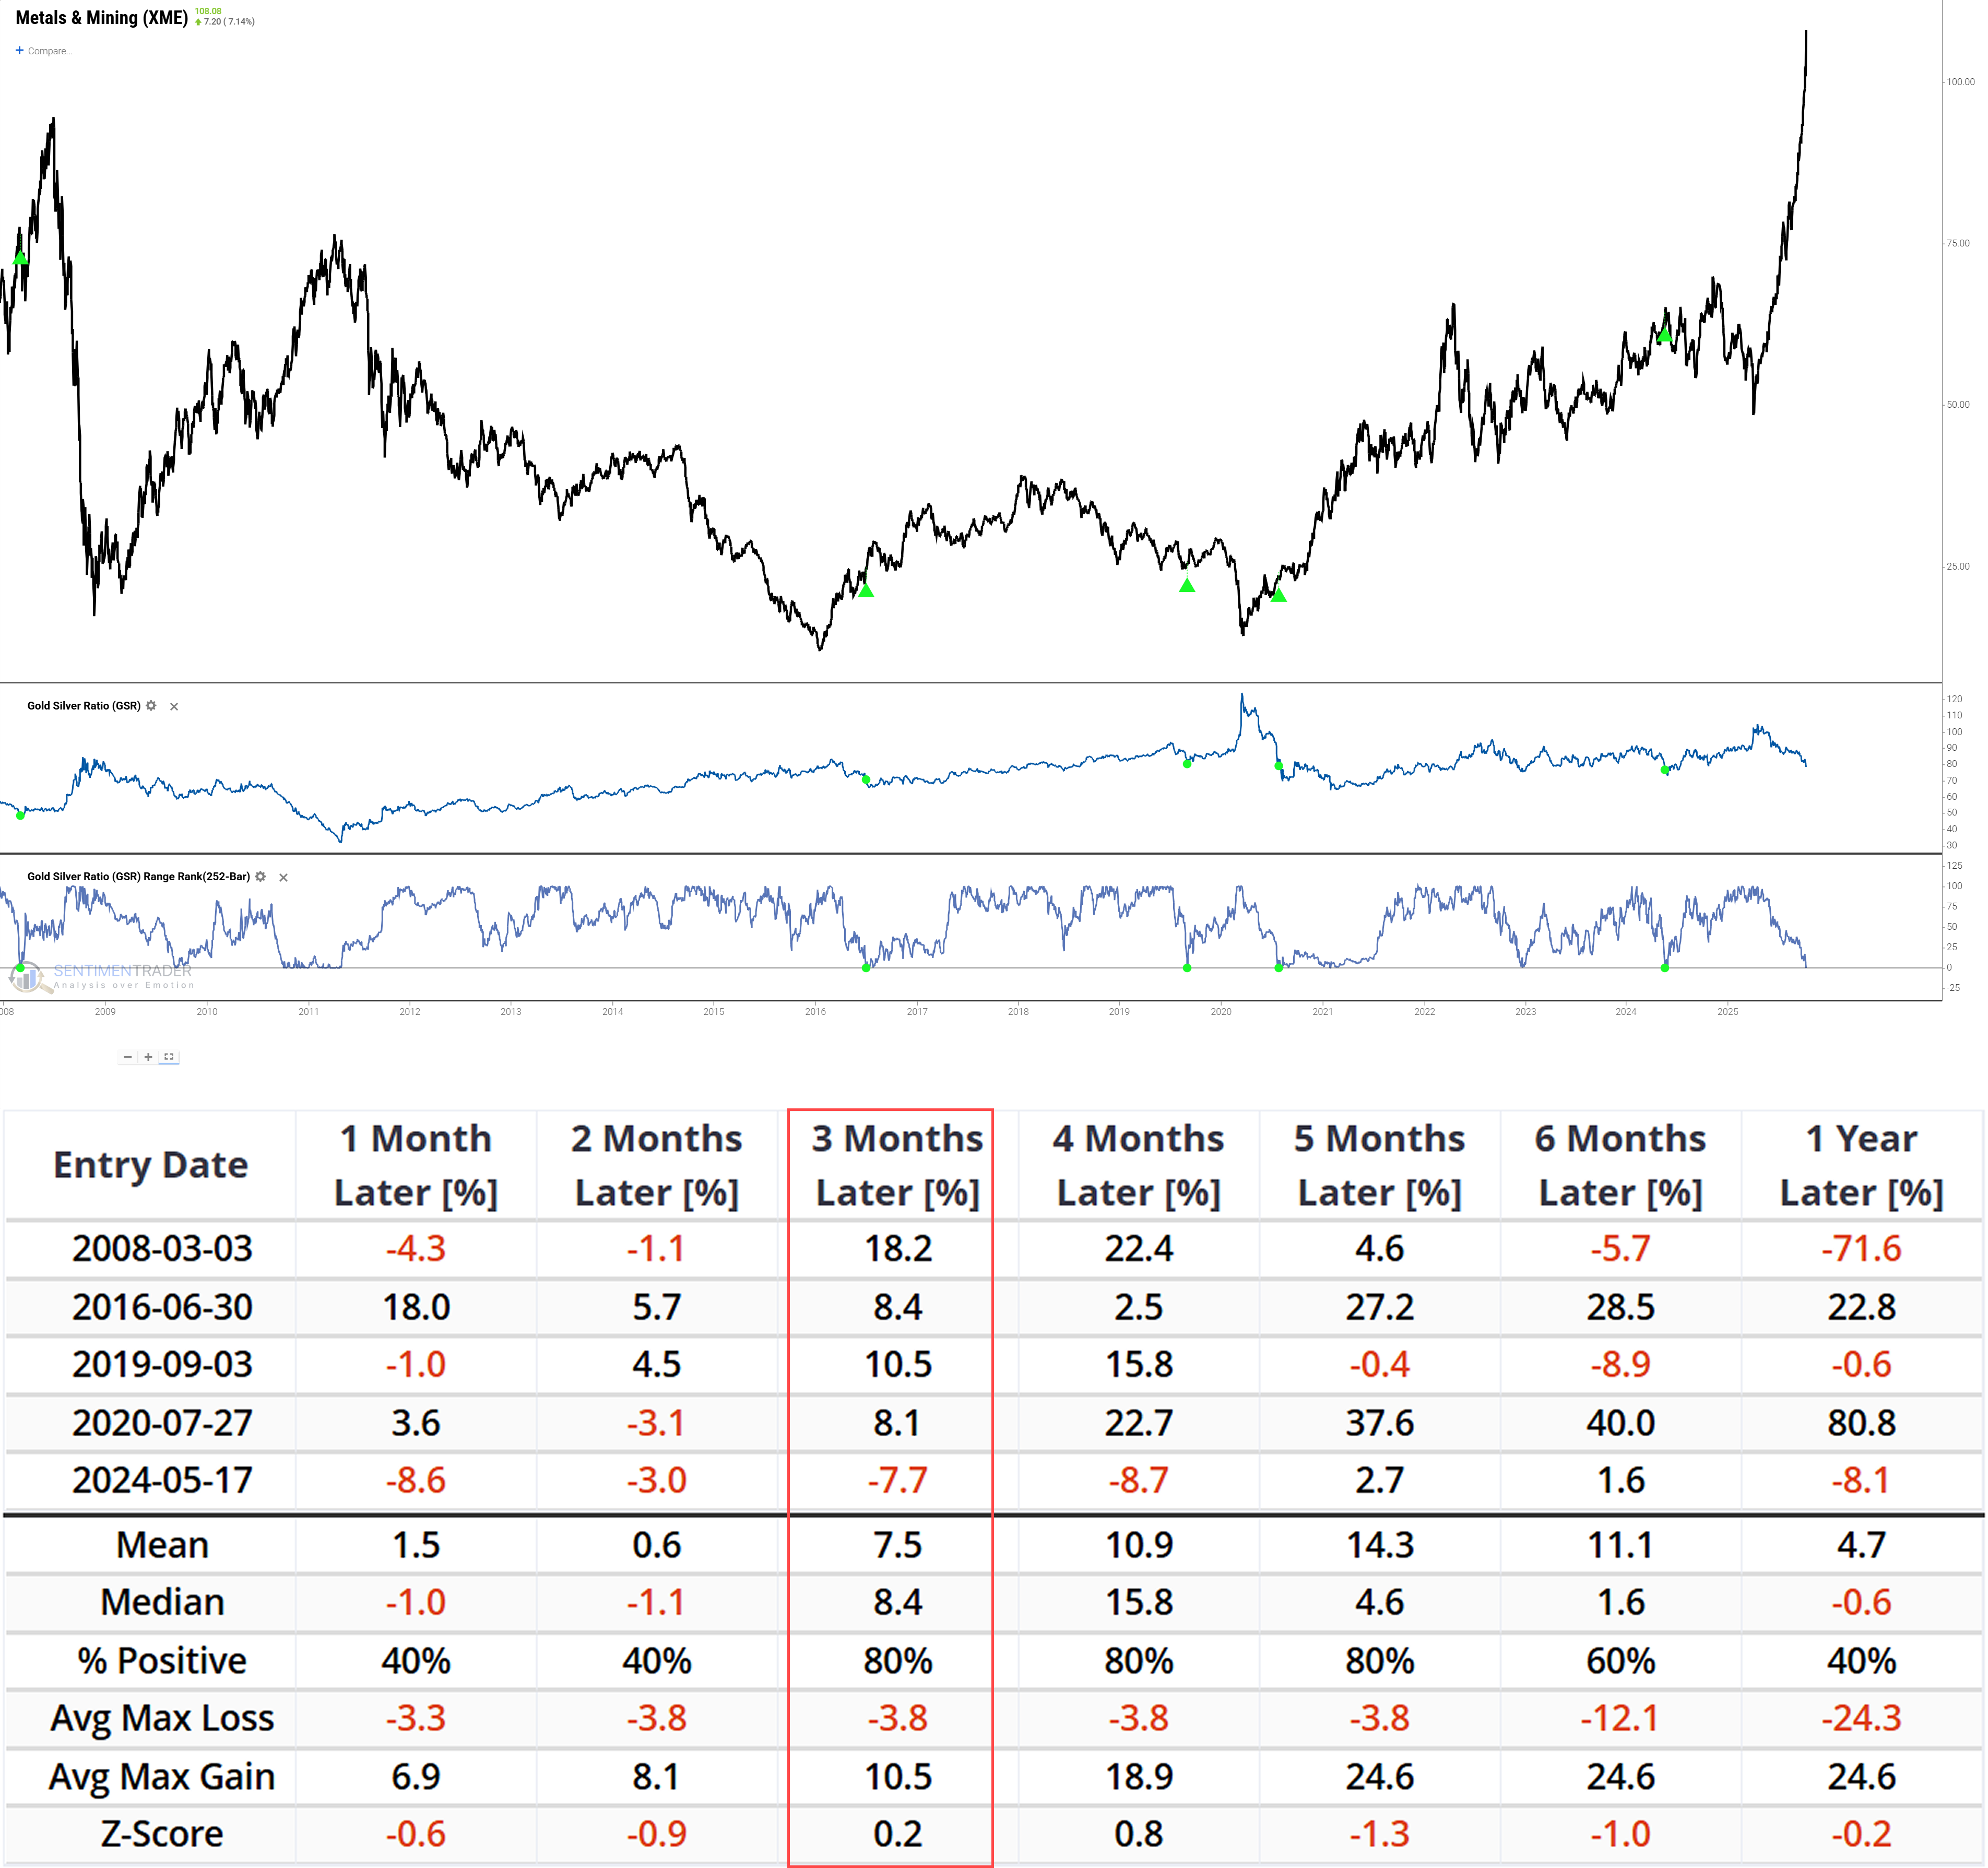
More notably, while precious metals entered a short-term correction, the Industrial & Precious Metals Miners ETF (XME) showed a completely different trend - despite lackluster performance immediately after the signal trigger, its median 3-month return reached a high of +8.4%, with an astonishing 80% probability of positive returns.Related Backtest Click Here.
Insights from Capital Flow Signals
The market contradiction stems from the general weakness following a "GSR Shock," which has led us to delve into capital flows to distinguish between short-term sentiment and real institutional behavior. It should be noted that while the initial backtest focused on sharp GSR collapses within 126 days, the subsequent capital flow analysis expanded to the full "peak-to-trough" cycle within the 252-day ranking window (to cover more historically similar scenarios and improve the sample size and conclusion reliability of the backtest).
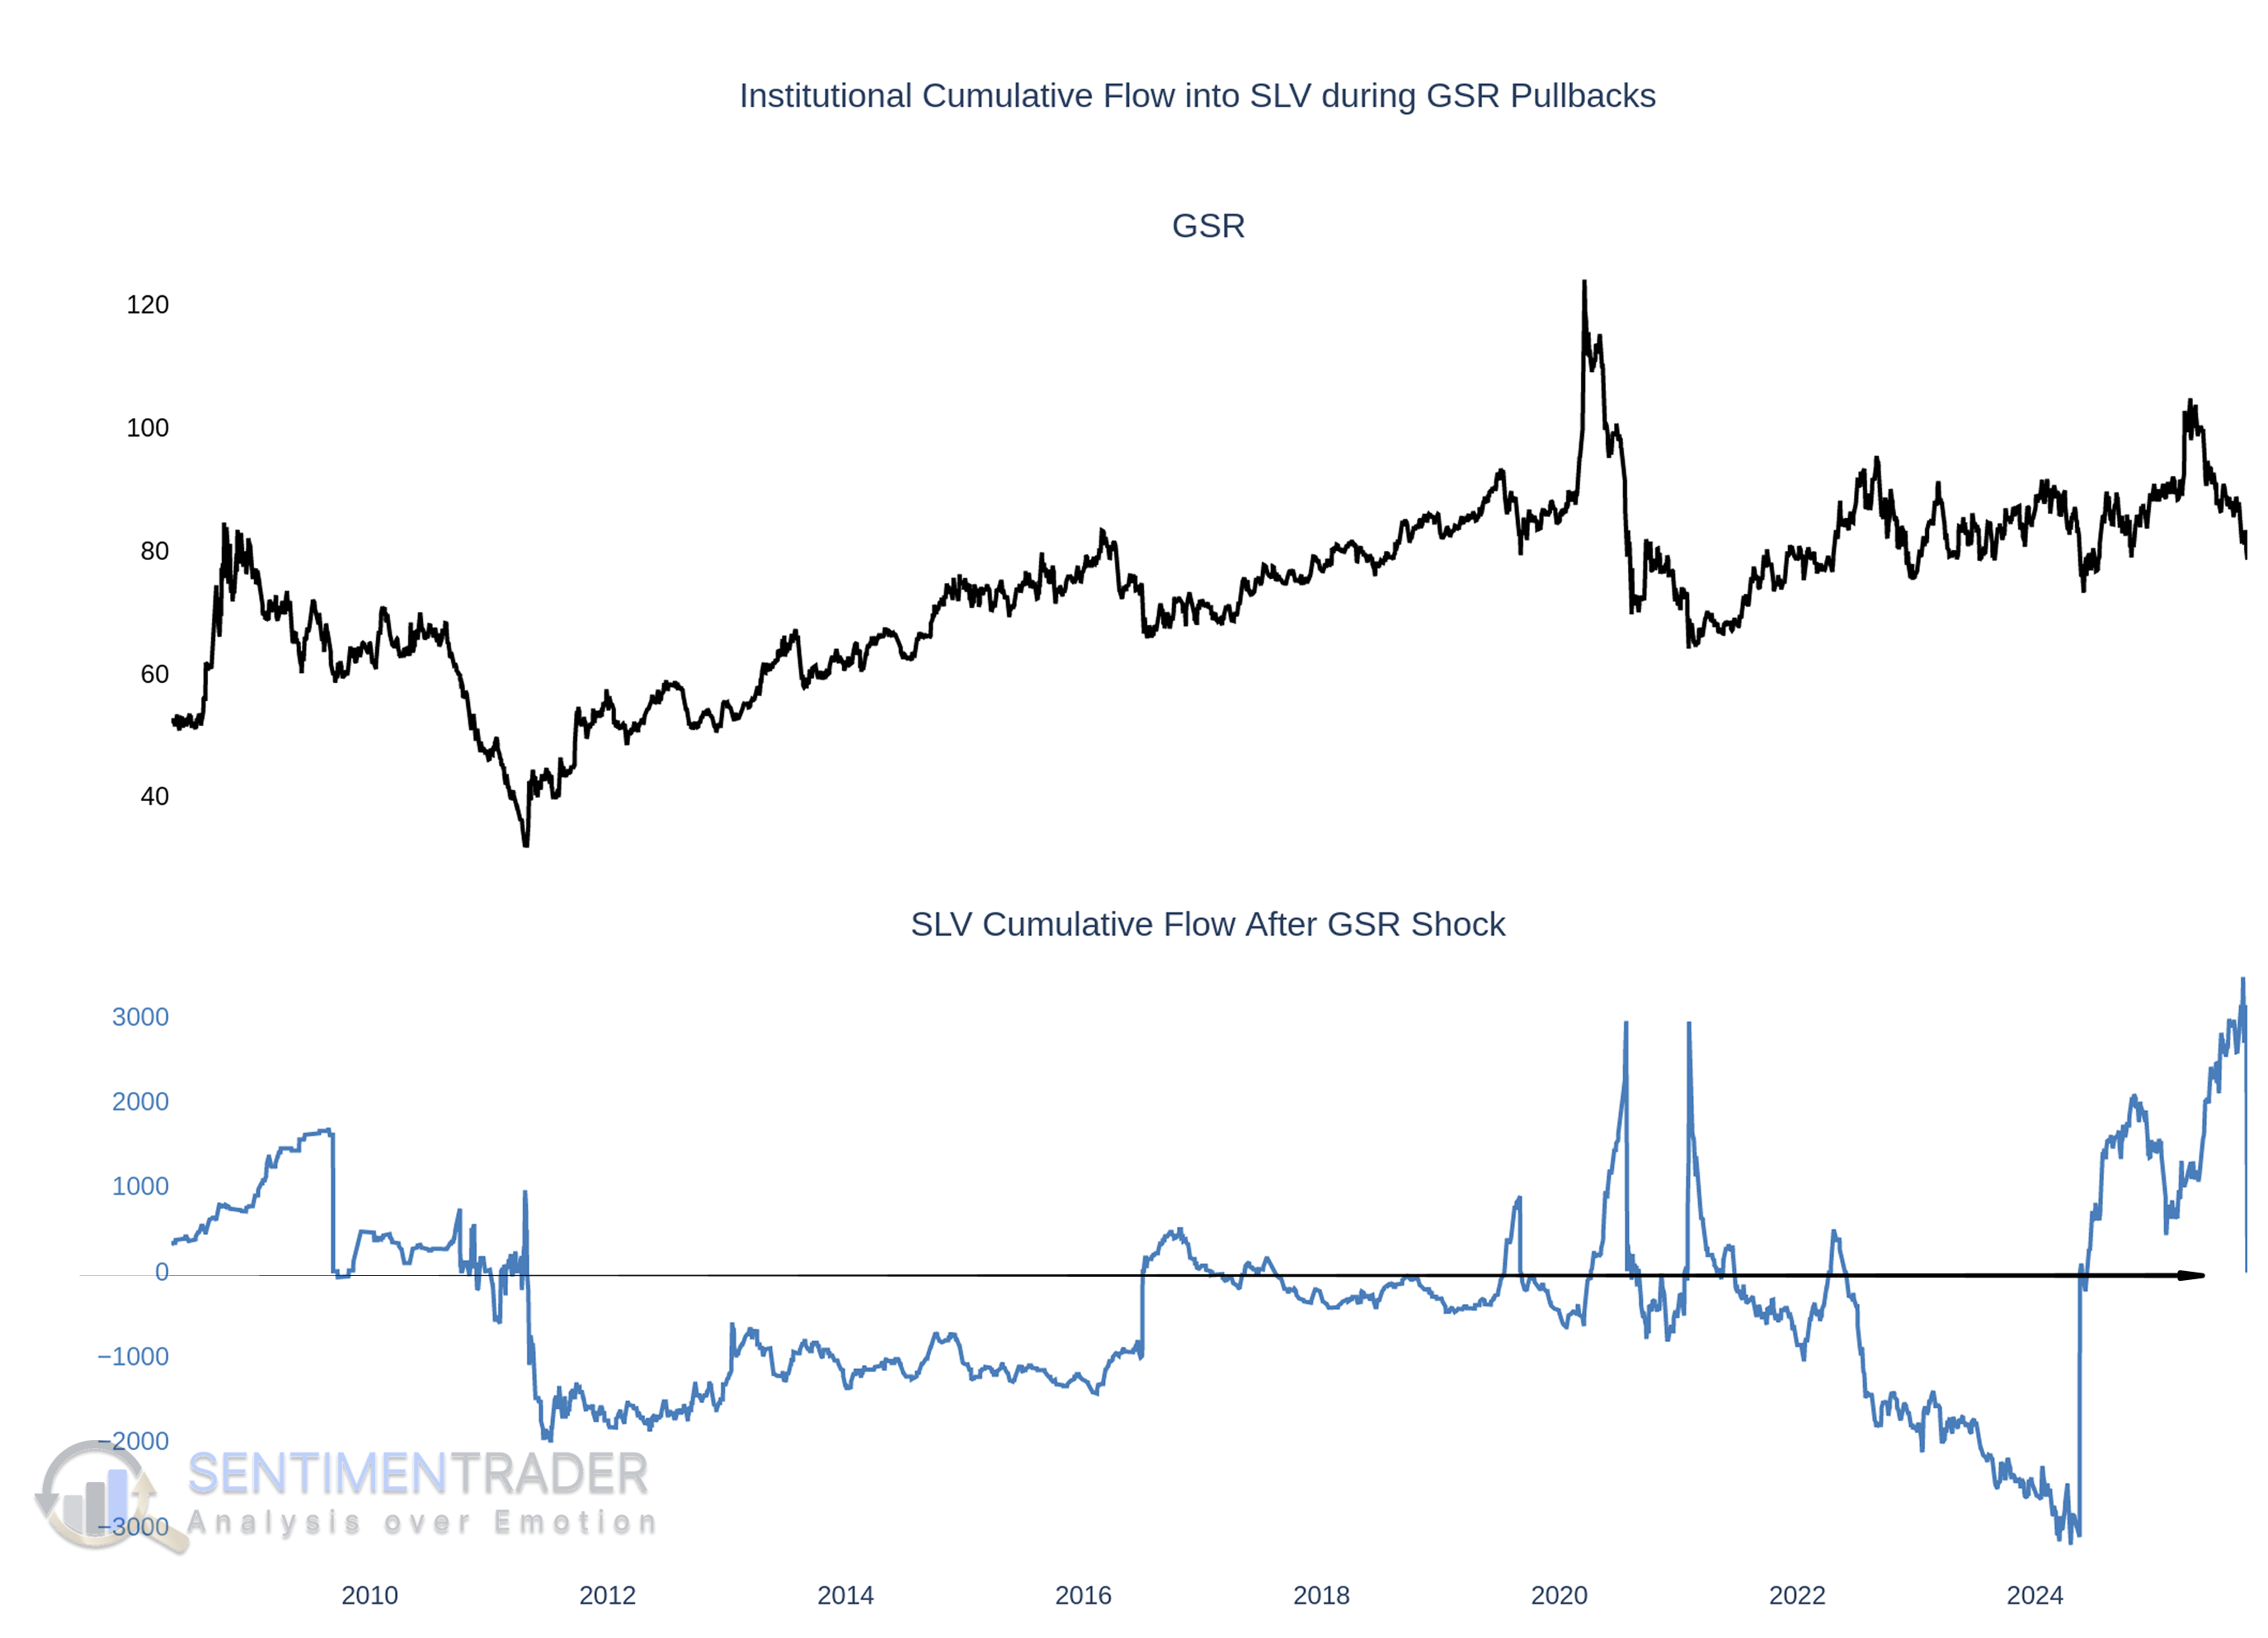
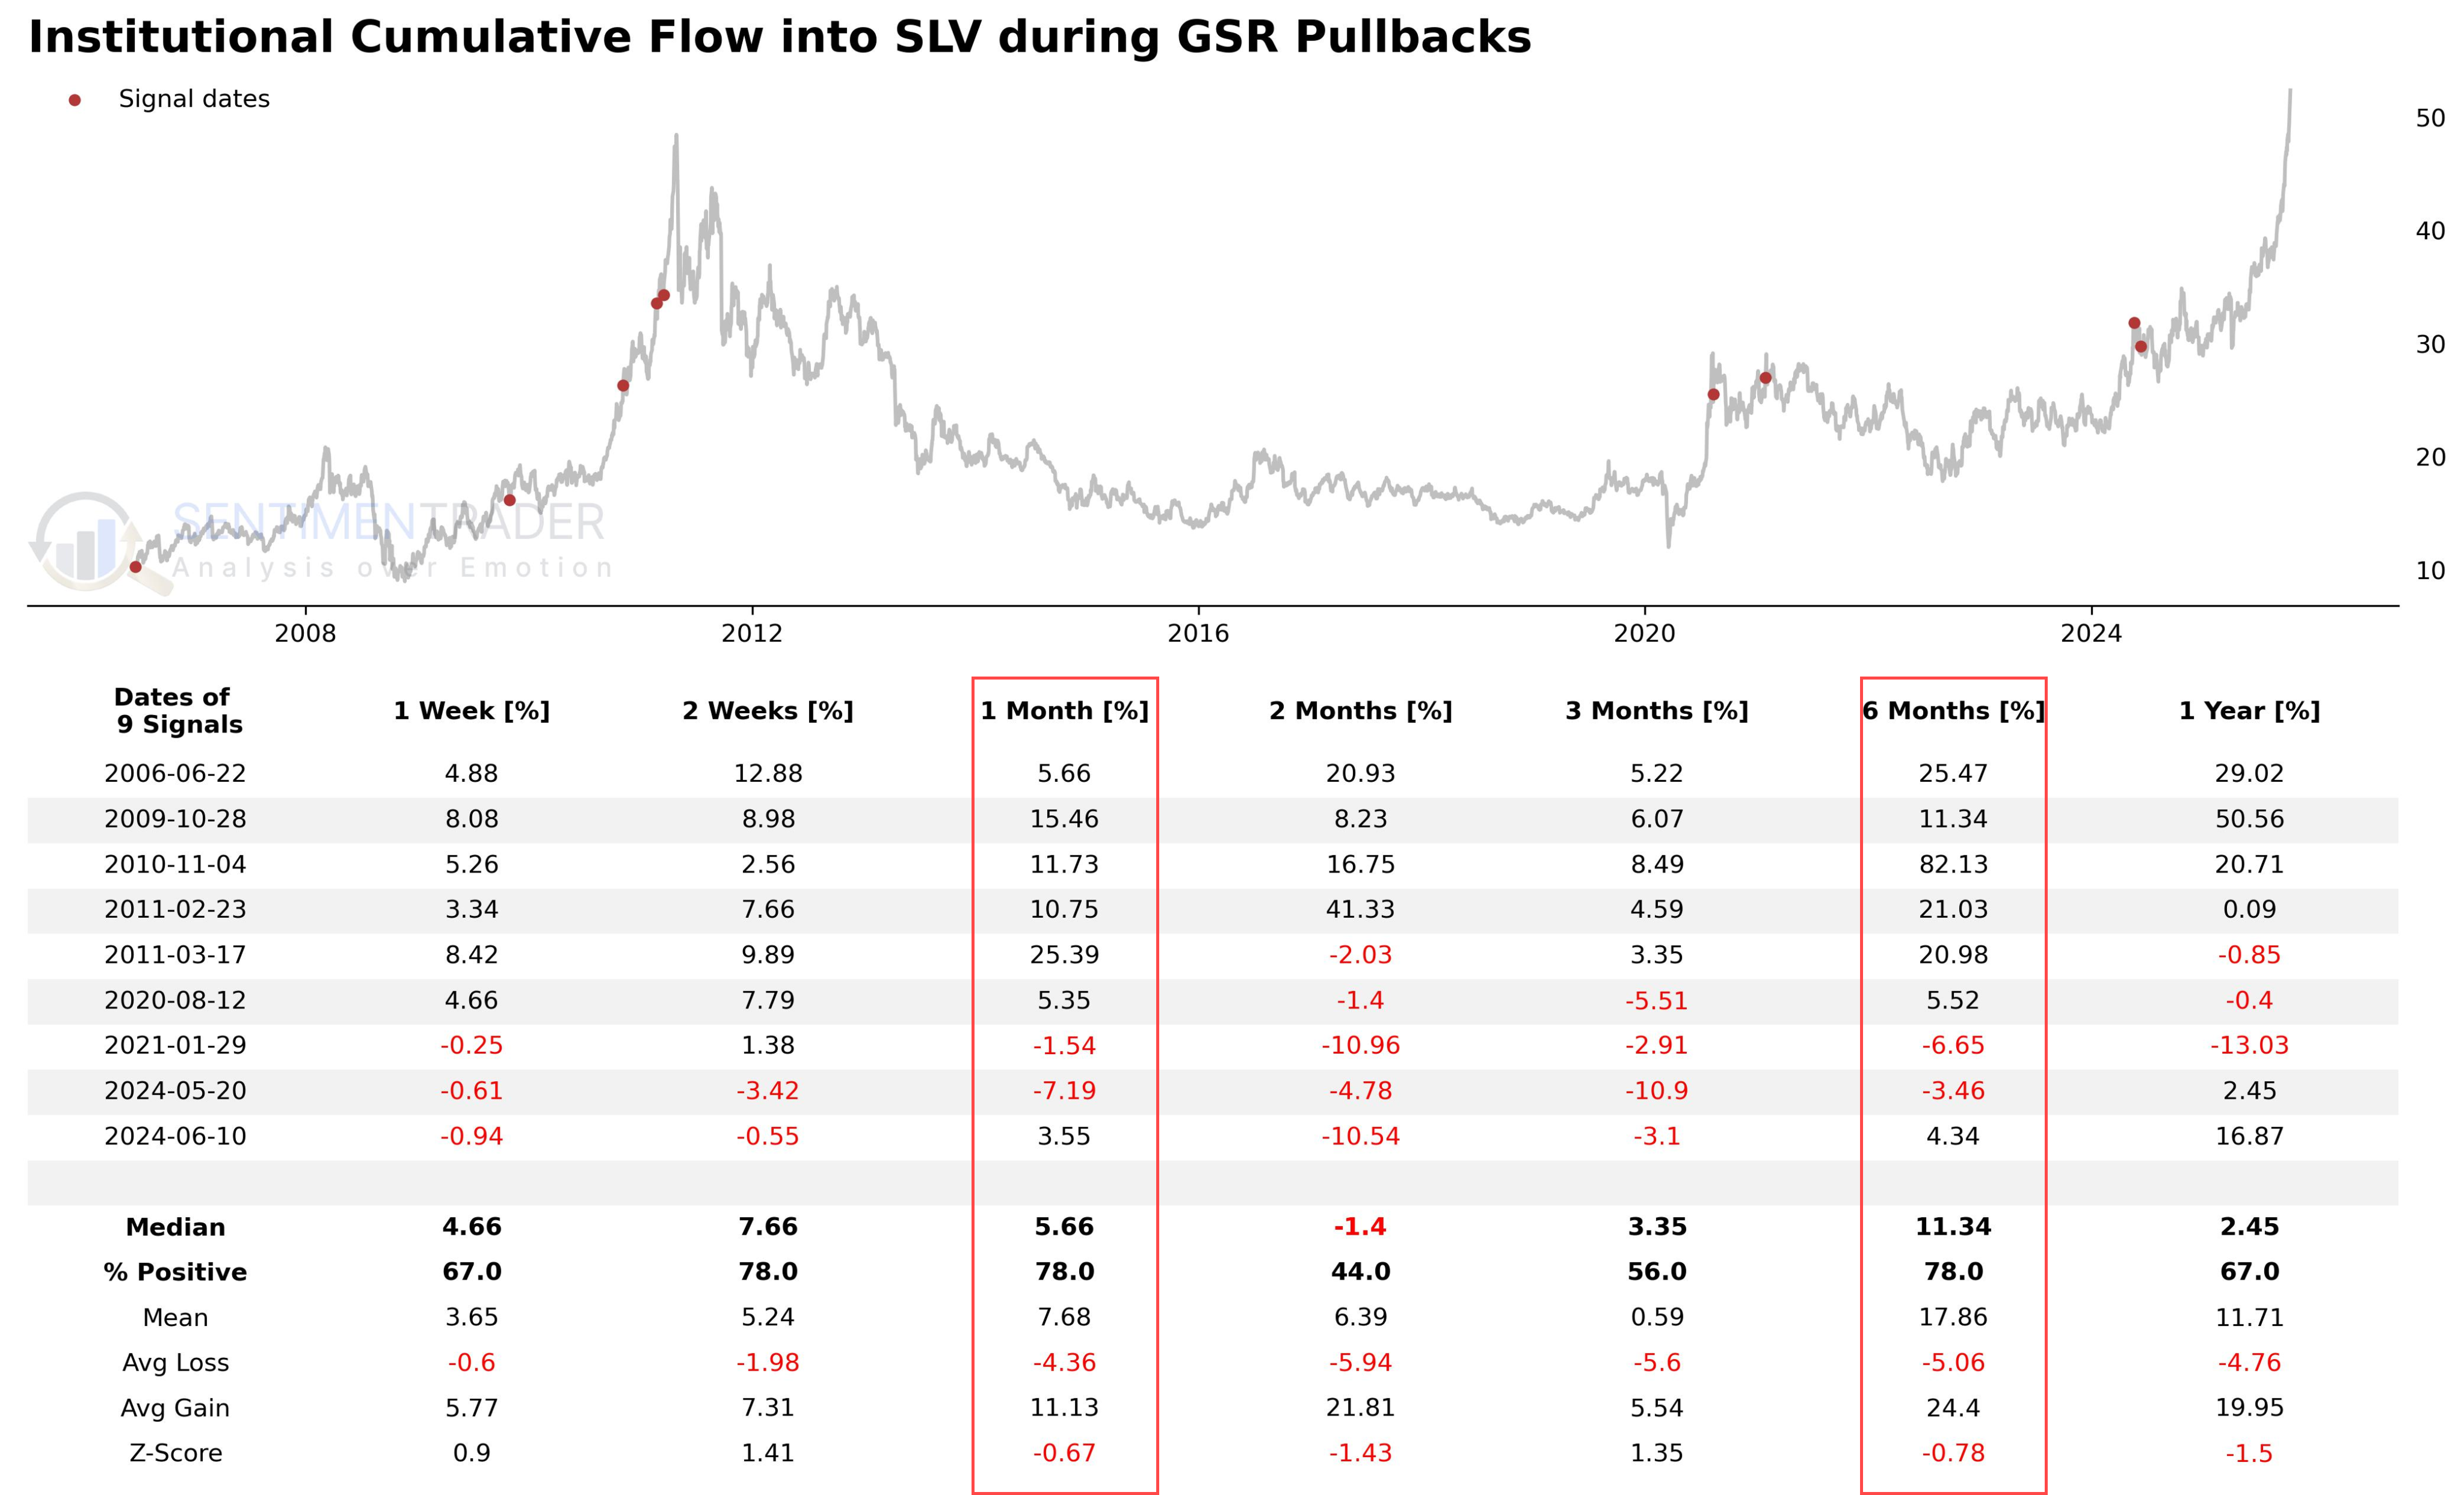
The signal most strongly associated with positive performance is the "Capital Accumulation Confirmation" - after a "GSR Shock," the cumulative net flow of ETF daily capital flows turns from negative to positive for the first time. One month after this signal is triggered, the median return is +5.66% with a 78% probability of positive returns; this positive correlation extends to 6 months, with a median return of +11.34% and a remaining 78% probability of positive returns.
The Complexity of the "Physical Lock-Up" Signal
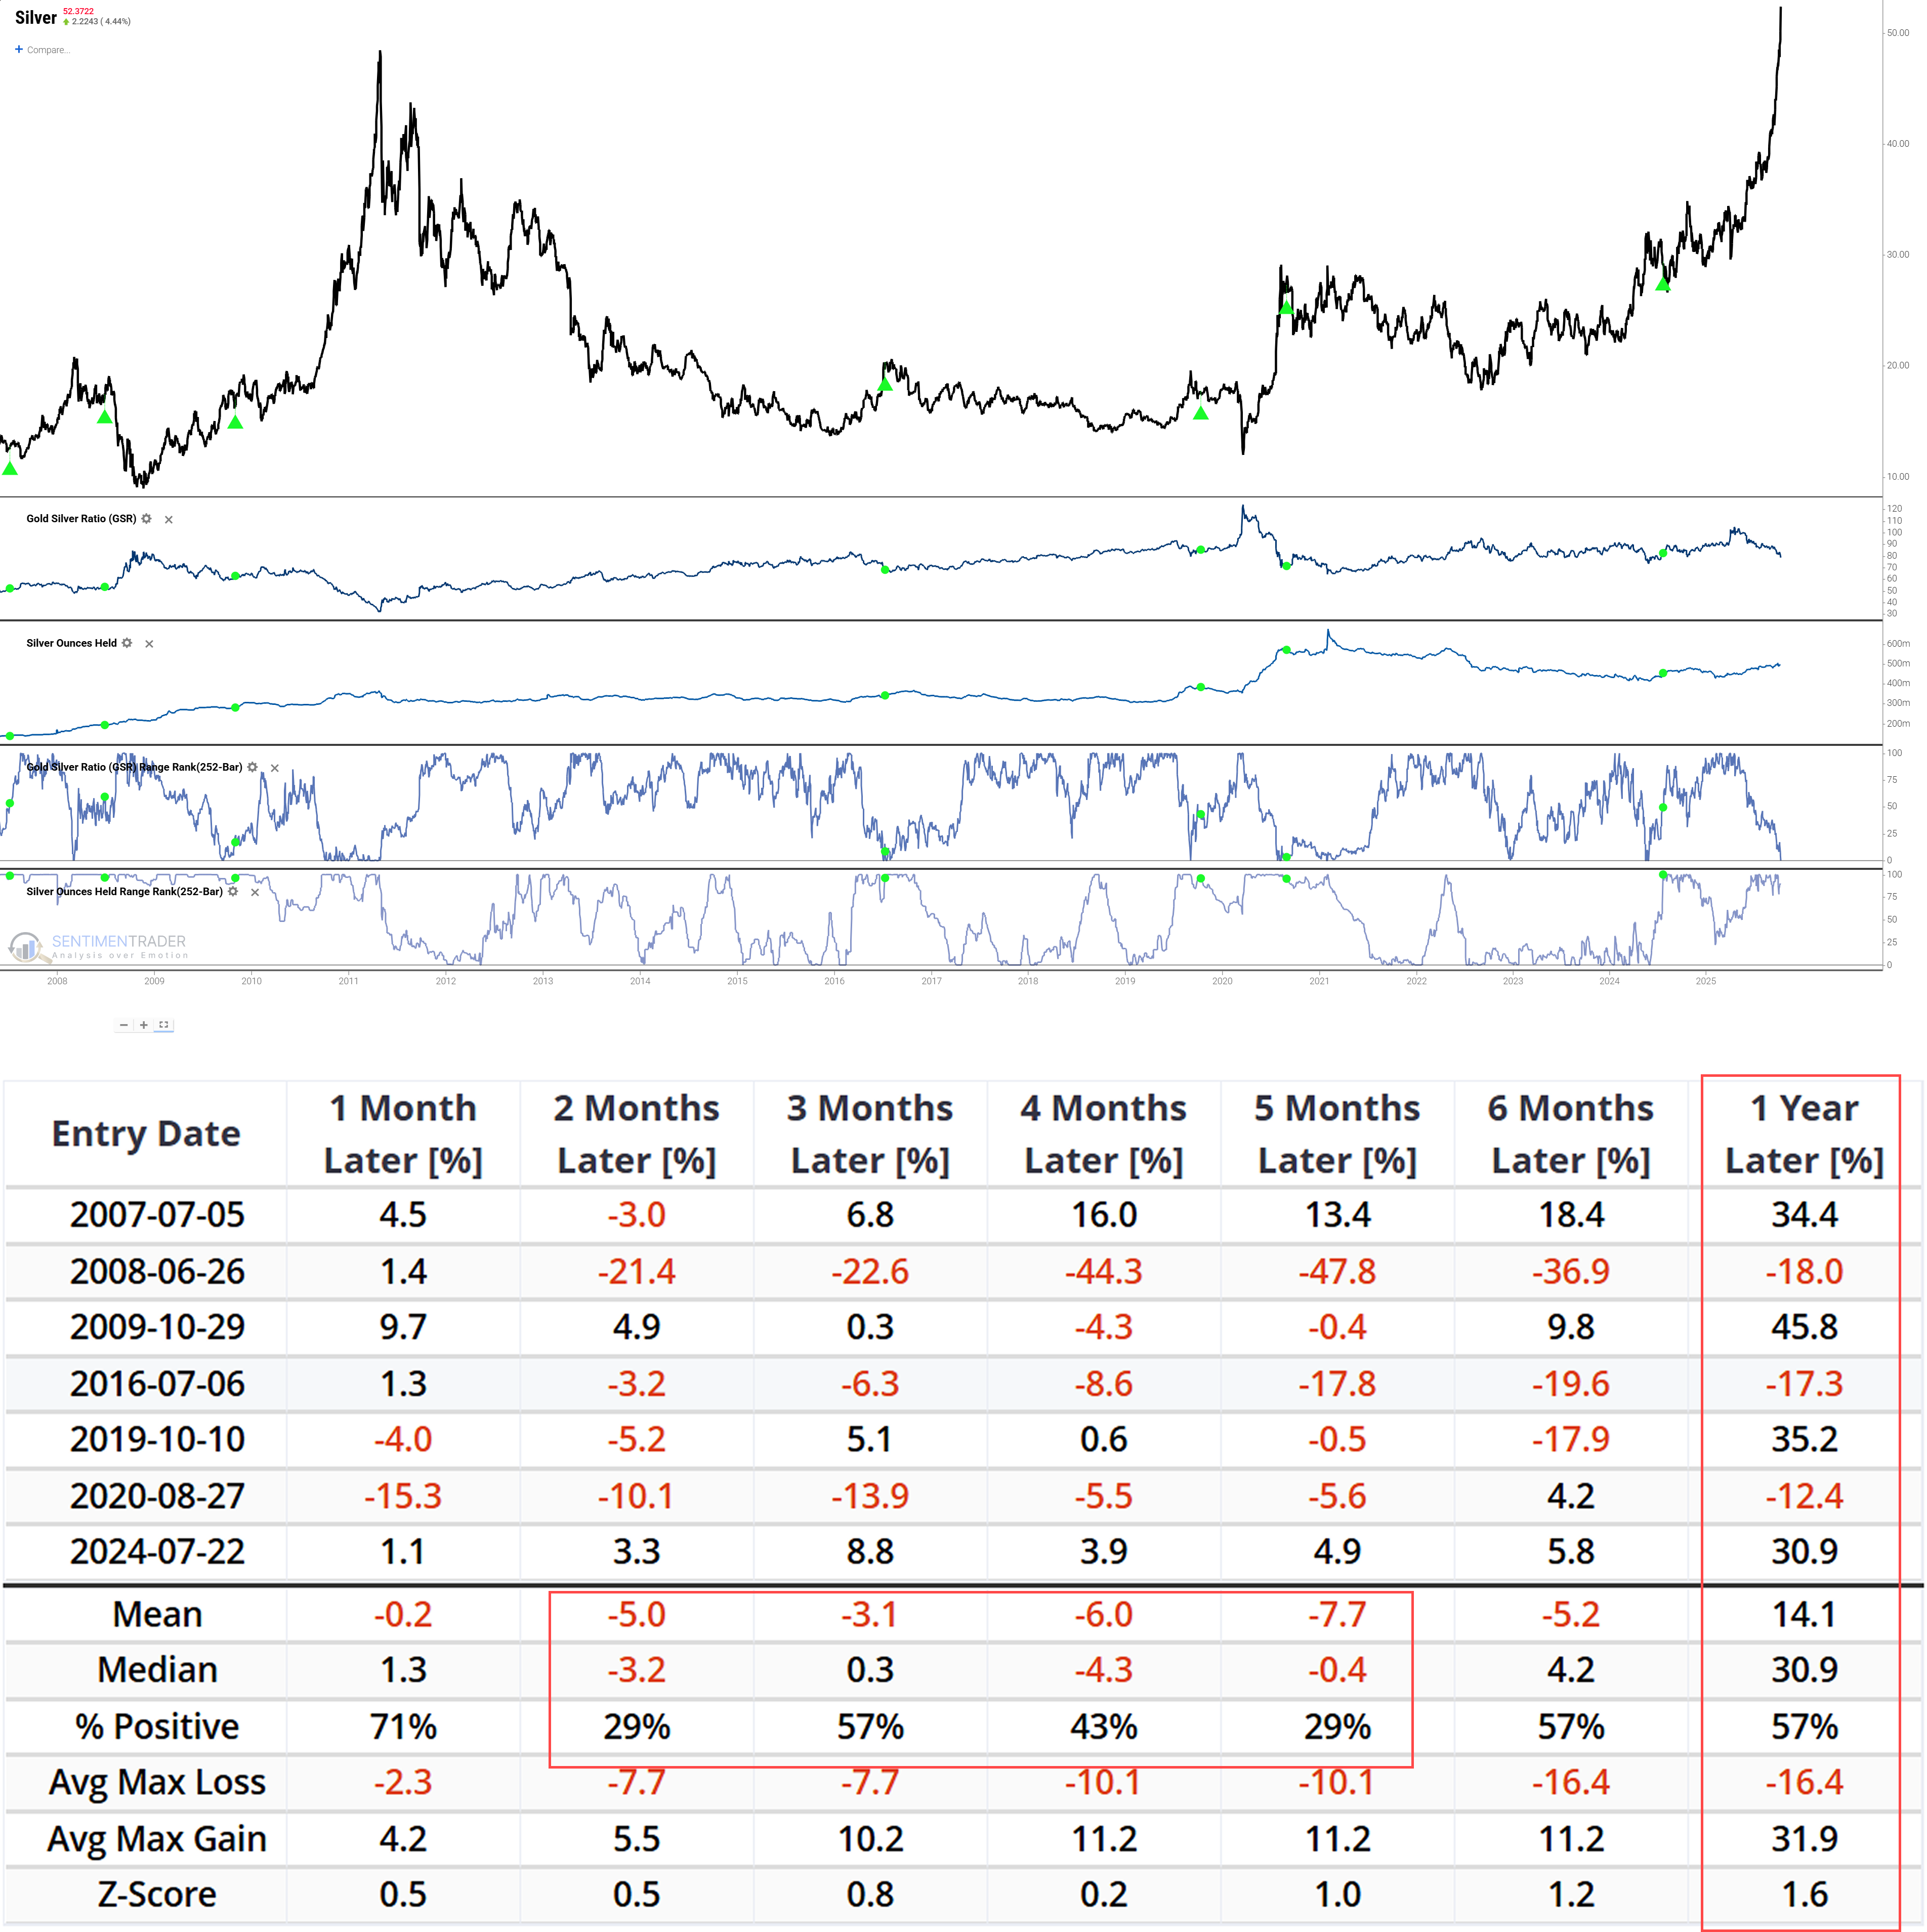
The key to understanding the current market rhythm lies in an extremely complex and deceptive signal: "Physical Lock-Up". We define it precisely as: within the window period after a "GSR Shock," the growth in physical silver holdings of ETFs reaches the top 5% of extreme levels in the past year for the first time.
This signal shows attractive strength in the very short term (within 1 month) (71% probability of positive returns), but this is often a "bull trap." This strength quickly reverses, and the market generally experiences significant deep corrections in the subsequent 2 to 5 months, during which the probability of positive returns plummets to a freezing point of 29%-43%.
In the long term, however, this signal exhibits extreme asymmetry: after a brutal mid-term correction, its 1-year win rate is only a mediocre 57%, but the median return is as high as +30.9%. This reveals a crucial insight: extreme physical buying following a GSR Shock marks the market's entry into a "high-risk, high-reward" gaming phase, with a process fraught with enormous uncertainty and potential for substantial losses.Related Backtest Click Here.
What the research tells us...
The core contradiction in the silver market is not whether the industrial narrative is valid, but whether this strong narrative can overcome the historically weak performance of the "GSR Shock" signal - when this signal appears alone, subsequent market performance is often uncertain. Long-term industrial demand may indeed exist, but the pace of market evolution is crucial.
Historical data shows that the most stable positive performance mostly occurs after the "Capital Accumulation Confirmation" signal appears, which marks a structural shift in capital flows. The "Physical Lock-Up" signal, on the other hand, is a high-risk, high-reward long-term indicator that requires market participants to withstand significant mid-term volatility.
It is important to emphasize that historical data reveals correlations rather than causal relationships, and the number of signal samples is limited; the current macro environment (interest rates, geopolitics, industrial demand structure) may differ from historical periods. For market observers, the biggest risk currently is overinterpreting the October 13 "GSR Shock." This research is an analysis of historical pattern data, not a tool for future prediction - after a macro signal, carefully observing subsequent capital flows is the key to judging the market's inherent strength.