
Signs of stagflation appear in the manufacturing sector

Key points:
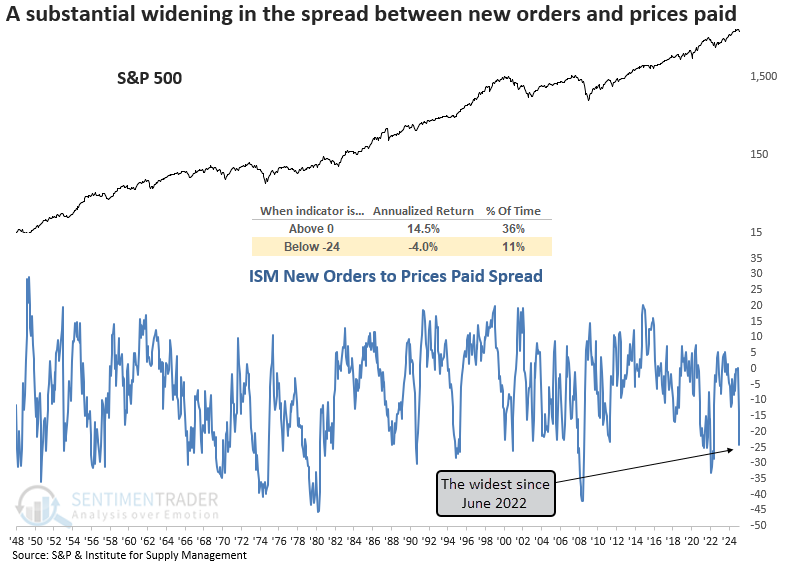
- The ISM new orders to prices paid spread plunged to the lowest level since June 2022
- Similar indications of stagflation suggest stocks could struggle over the following year
- Consumer discretionary, technology, and financials suffered as energy outperformed
Could a critical measure of growth and inflation signal a second wave of inflation?
On Tuesday, the Institute for Supply Management released its survey results for March. The data was not encouraging as the spread between new orders and prices paid plunged below -24%, marking the widest margin since June 2022, a period characterized by elevated inflation. This sharp contraction signals that future manufacturing demand is deteriorating as input costs rise, a hallmark of stagflation.
A divergence of this magnitude often aligns with economic slowdowns, leading to a challenging stock market environment. The chart below shows that when the new orders-to-prices-paid spread resided below -24%, the S&P 500 delivered an annualized return of -4%, starkly contrasting its performance when the spread was positive.
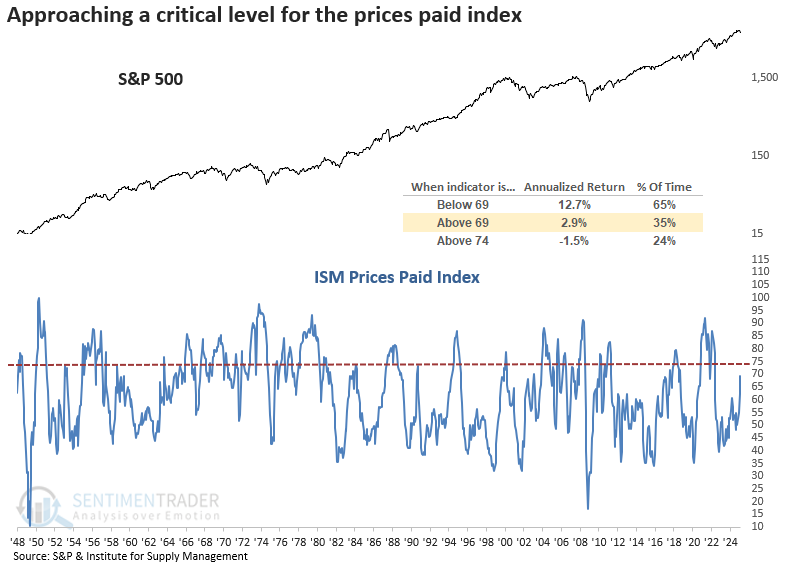
The prices paid index rose to 69.4, a level associated with S&P 500 annualized returns of 2.9%, well below returns observed when the index is under 69 or the long-term average since 1948. Furthermore, once the index surpasses 74, annualized returns drop to -1.5%.
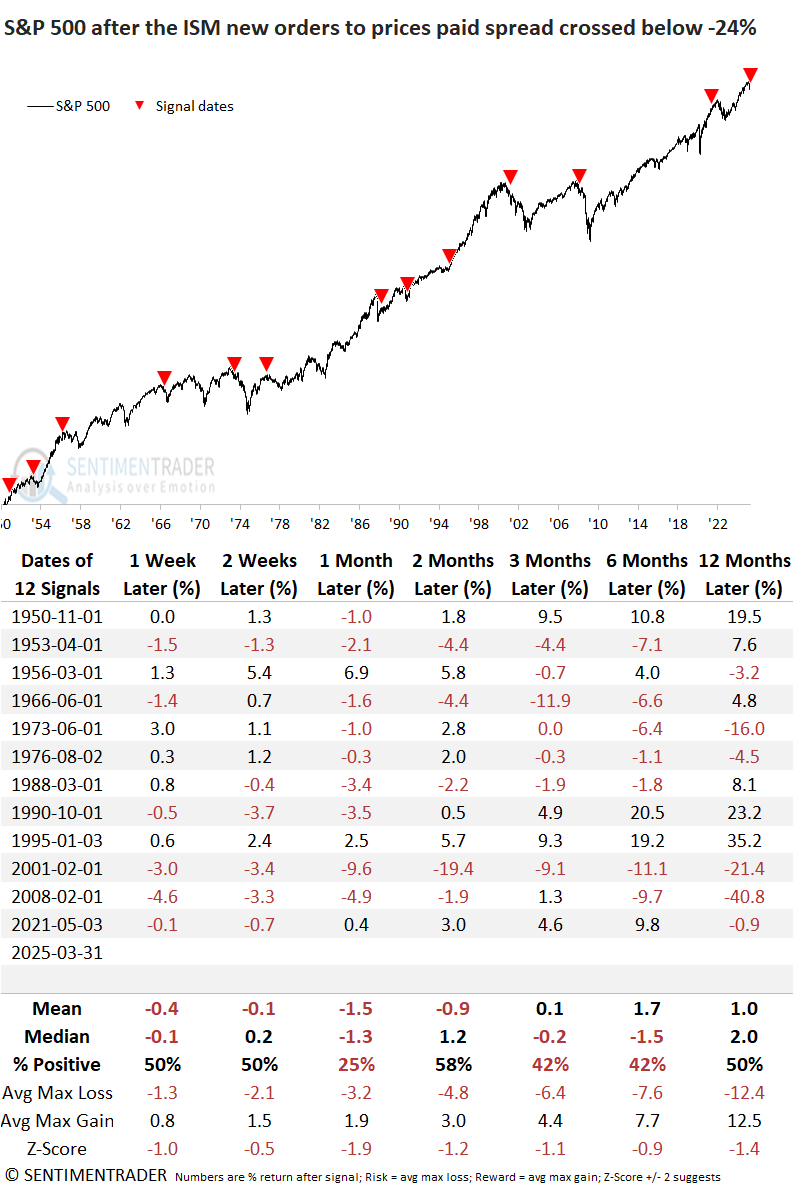
I adjusted the signal dates to reflect the first business day of each month. i.e., the release day.
Similar indications of stagflation in manufacturing suggest a cautious outlook for stocks
Whenever the ISM new orders to prices paid spread dropped below -24% for the first time after a positive reading, the S&P 500 tended to struggle over the next year. The market was particularly weak in the first month, with losses occurring 75% of the time. Moreover, several precedents occurred near the outset of bear markets.
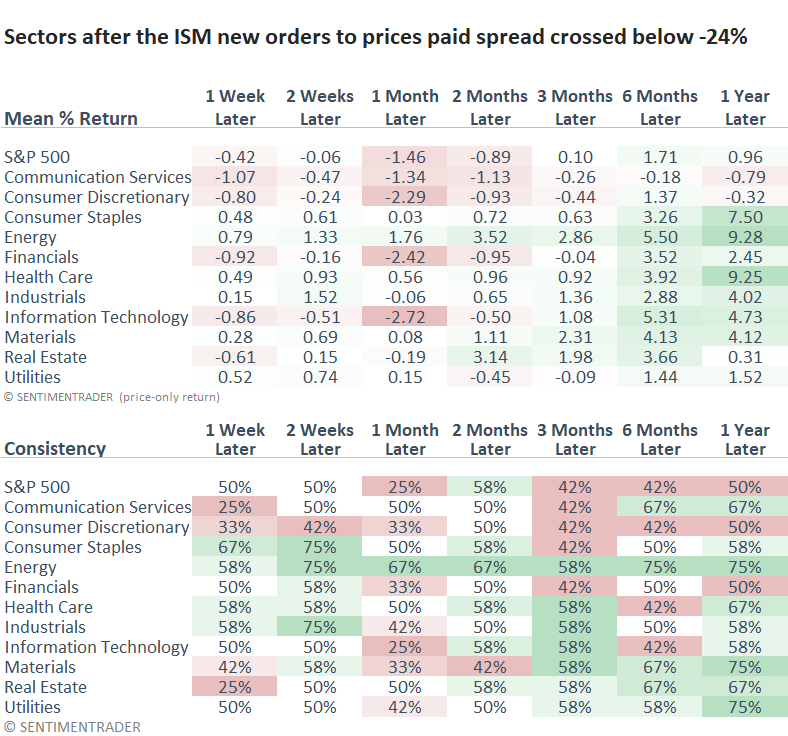
Sector performance after signals
Consumer discretionary and technology, both hit hard during the recent correction, show little promise for the next month. In contrast, energy, the year's top performer, may continue to thrive in a stagflationary environment.
Gold is often considered an inflation hedge. Given the current uptrend, I decided to assess its outlook. Interestingly, owning gold added little value. Those looking for a more favorable inflation hedge would have been better off in energy stocks.
What happens to year-over-year CPI after signals
Applying the signal dates to the year-over-year reading for the Consumer Price Index (CPI) suggests consumer inflation is likely to increase, as the widely followed measure has risen 75% of the time over the next three months.
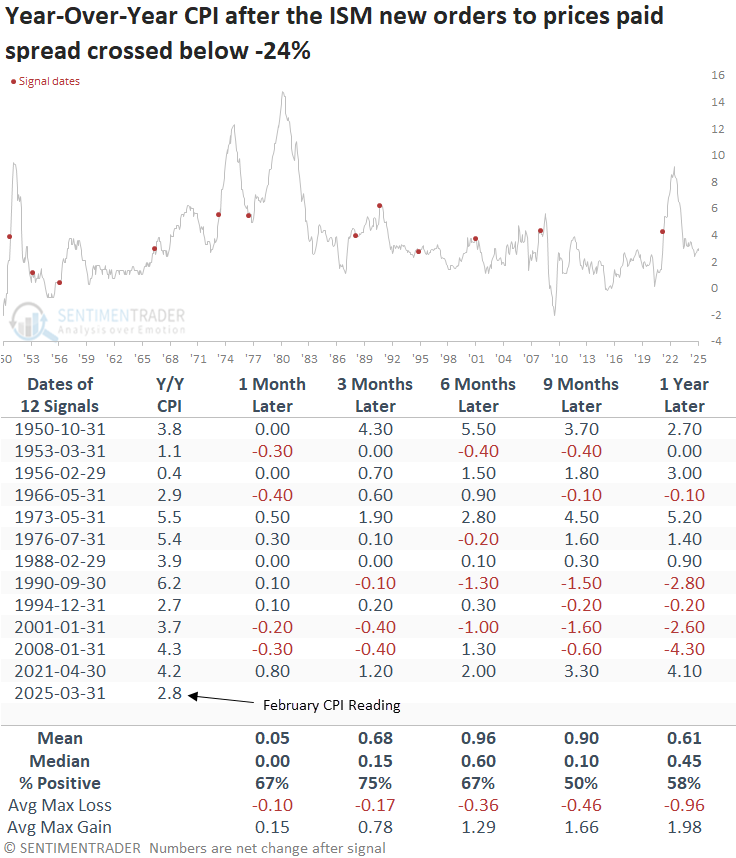
For now, consumer inflation remains in check. That said, I will be monitoring this CPI timing system given the outlook in the table above.
What the research tells us...
A purchasing managers' survey in the manufacturing sector revealed a drop in new orders alongside a surge in prices paid, marking the widest gap between these measures since June 2022, a scenario often linked to soft economic conditions. Consequently, this backdrop has historically pressured stocks, with the S&P 500 facing headwinds over the next year. Cyclical sectors like technology, consumer discretionary, and financials displayed a weak outlook, whereas energy, often an inflation hedge, tended to thrive following these signals. Although consumer inflation is not a problem, it's something to monitor as the spread between new orders and prices paid has often signaled it could tick up.
Evidence continues to emerge, suggesting the 10% correction could deepen, making patience and risk management essential. However, nothing moves in a straight line. So, don't rule out another bounce.