
Signficant Trends in Sugar and Unleaded Gas

Key Points:
- Sugar futures have been in a relentless downtrend since November 2023
- Meanwhile, Unleaded Gas futures have soared almost 35% since early January 2026
- Despite these huge moves, seasonality strongly suggests that now is not the time to fade these two markets
Sugar prices have declined relentlessly
The chart below shows price action for sugar futures for the past several years. As you can see, since November 2023, the action has been steadily to the downside, with sugar losing roughly half its value.
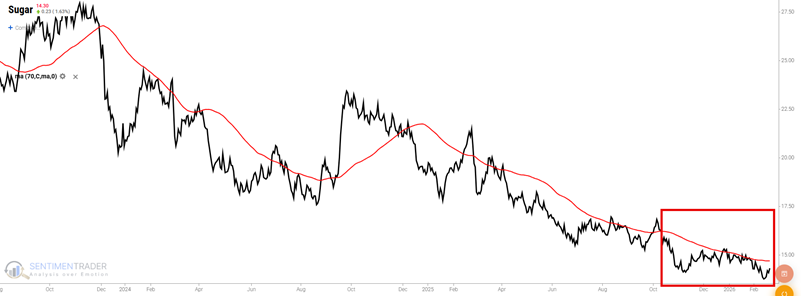
After a commodity loses half of its value, many traders can't help but wonder if a reversal may soon be at hand. We can't predict. However, seasonality strongly suggests that now is not the time to place that bet.
Sugar is entering its weakest seasonal time of year
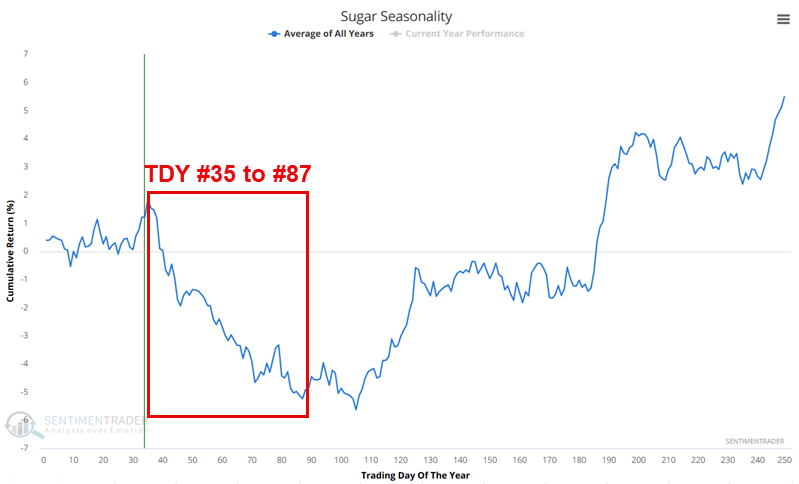
Sugar has a long history of being a very cyclical market. The chart below shows the annual seasonal trend for sugar futures. As highlighted in red, this market is entering what is generally the weakest time of year.
As always, it is essential to remind people that seasonality is backward-looking-i.e., it is simply an average of the past-and should never be thought of as a roadmap for what will happen in the current year. Still, history is what it is for sugar. The period of typical seasonal weakness highlighted above extends from the close of Trading Day of the Year (TDY) #35 through TDY #87. For 2026, this period extends from the close on 2026-02-23 through 2026-05-07.
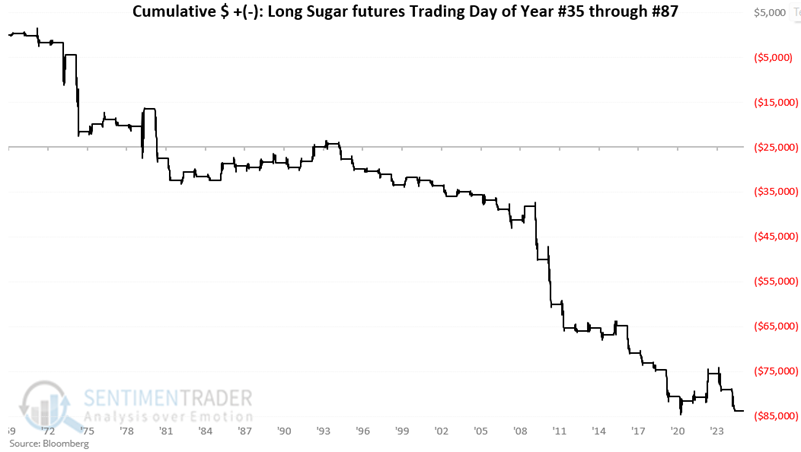
The chart below displays the hypothetical cumulative $ +(-) achieved by holding a long position in sugar futures only during this period, every year since 1970.
The table below summarizes sugar performance during the TDY #35 to #87 period.
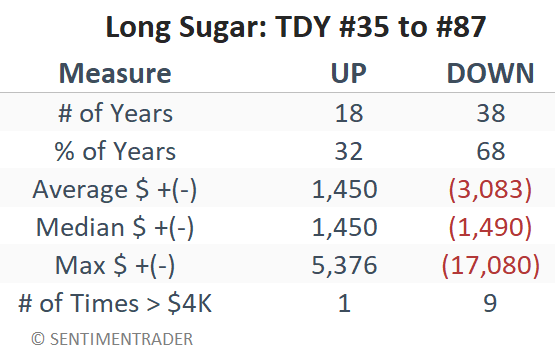
A 32% Win Rate means that this is by no means a "sure thing" for traders wishing to play the short side of sugar futures (although that would appear to be the better bet). Even more so, it means that a trader should have an excellent reason for wanting to risk capital on the long side of sugar in the weeks ahead.
Unleaded Gas is in the heart of a favorable seasonal period
While history has been unkind to sugar during the late winter, early spring period, Unleaded Gas futures have tended to experience just the opposite.
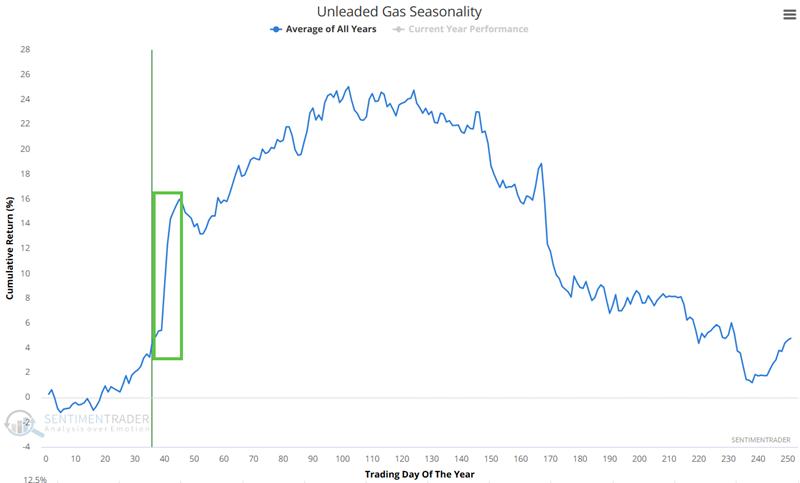
The chart below displays the annual seasonal trend for Unleaded Gas futures. The period highlighted extends from Trading Day #35 through Trading Day #45. For 2026, this period extends through March 5th.
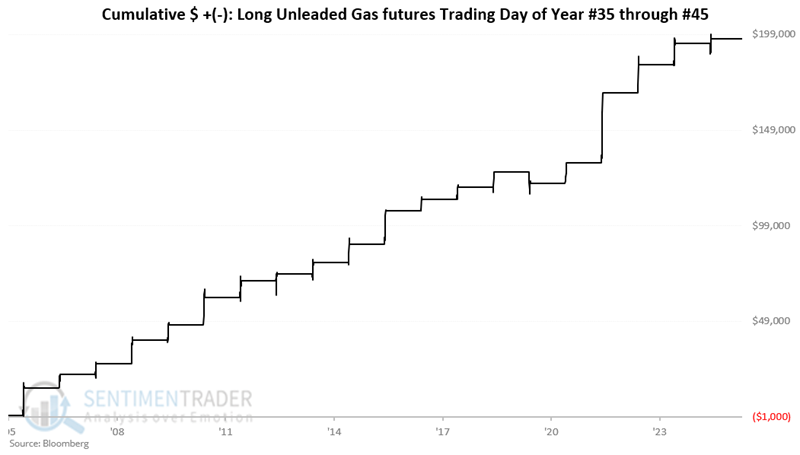
The chart below displays the hypothetical $ +(-) achieved by holding a long position in Unleaded Gas futures only during this period since 2005.
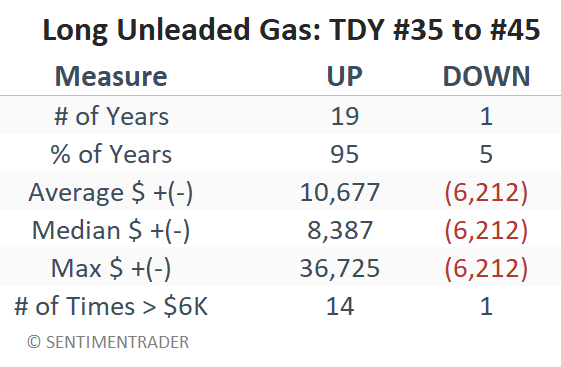
The table below summarizes Unleaded Gas performance during this period.
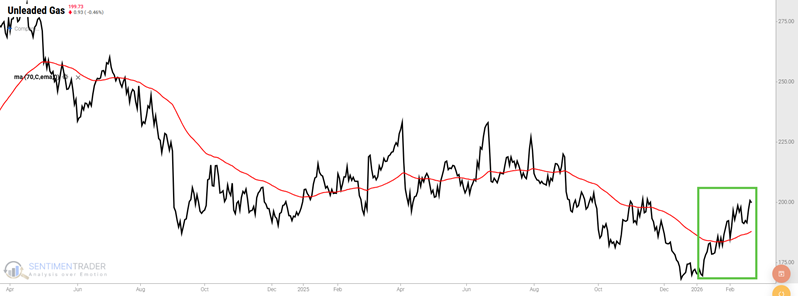
As you can see in the chart below, Unleaded has been in a powerful uptrend recently. The seasonal information suggests that now is not the time to take a contrarian stance - nor even to let one's foot off the gas, so to speak.
What the research tells us…
Sometimes strong trends make traders uneasy, leading them to wonder whether to stick with the current trend or play for a reversal. The combination of price trend and seasonality can be beneficial in deciding which side of a given market to play. Sur has been in a relentless, prolonged decline and could reasonably be expected to bounce higher. However, seasonality strongly warns against that action, and in fact, strongly suggests continuing to play the short side. Conversely, Unleaded Gas has shot higher in the last two months, and seasonality strongly suggests continuing to play the long side for a while longer.