
Signals, signals and more signals

Key points
- Favorable indicator signals should be thought of as "weight of the evidence" and not as automatic "buy signals"
- Still, when a sizeable number of indicators generate favorable signals within a short time frame, it often signifies a buying opportunity for stocks
- In a few weeks, we have gone from seeing many overlapping "oversold" signals to many "breadth" signals
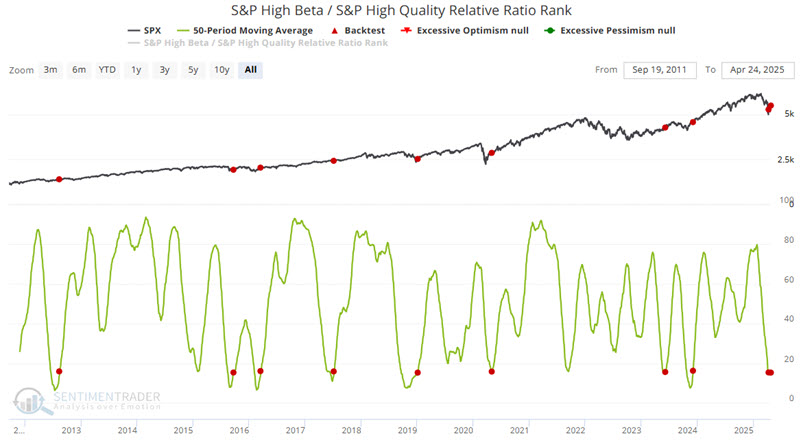
S&P High Beta / S&P High Quality Relative Ratio Rank reverses
The S&P High Beta / S&P High Quality Relative Ratio Rank indicator shows where the ratio is relative to its range over the past four months. When the relative ratio is high, investors are showing risk-on behavior. When the ratio drops to a low level, they exhibit risk-off behavior.
One useful application is looking for a slightly longer-term moving average to fall to a low level and then reverse higher. The chart below highlights those dates when this indicator's 50-day moving average crossed above 15.2. The signal on 2025-04-24 is the second in the last eleven trading days.
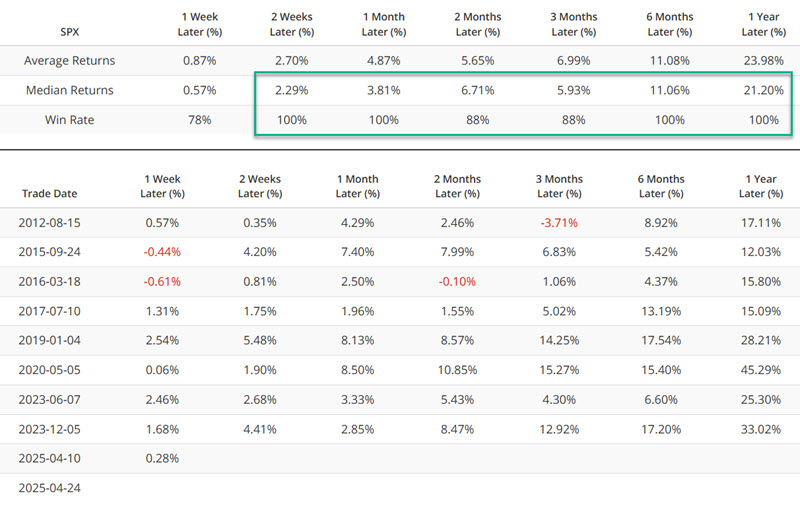
The table below displays S&P performance following the signals highlighted above.
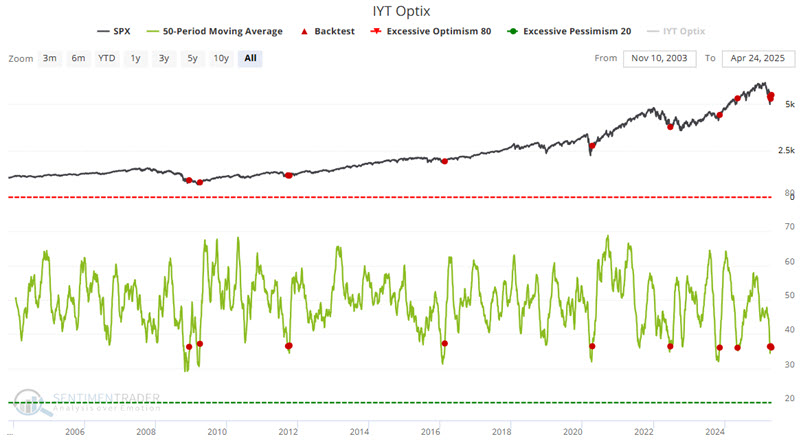
Transportation sector sentiment reverses off a low
Our IYT Optix indicator measures investment sentiment related to the transportation sector. It recently reversed from an overly bearish level. The chart below highlights those dates when the 50-day moving average of this indicator crossed above 36.
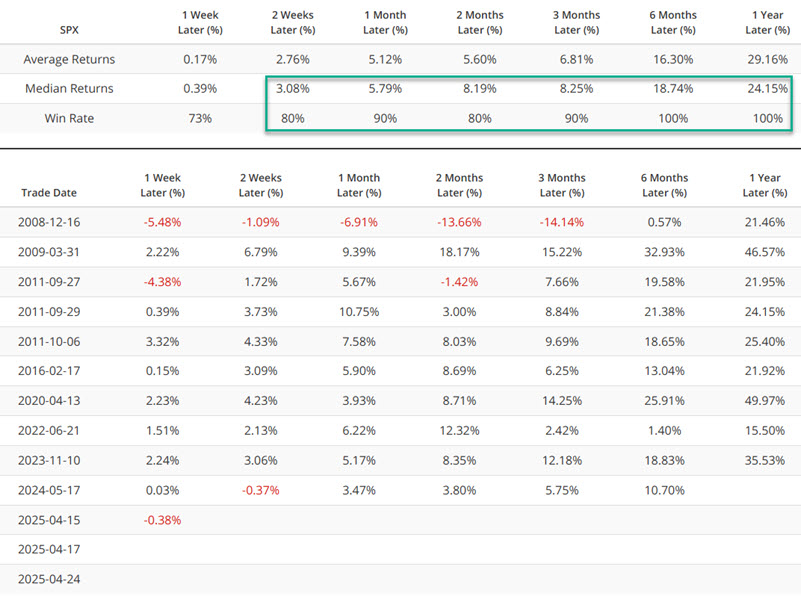
The table below displays S&P performance following the signals highlighted above.
NYSE Up Volume spikes
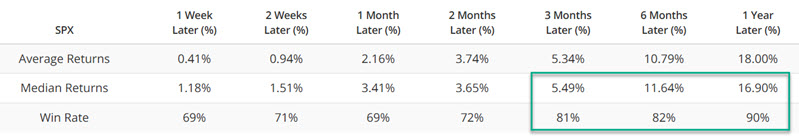
Our NYSE Up Volume Ratio measures volume traded in issues that closed up on the day on the New York Stock Exchange as a percentage of total up and down volume. The chart below highlights those dates when the 3-day moving average of this indicator was above 80 since 1962. This tends to highlight significant breadth thrusts that are generally considered favorable for the stock market.
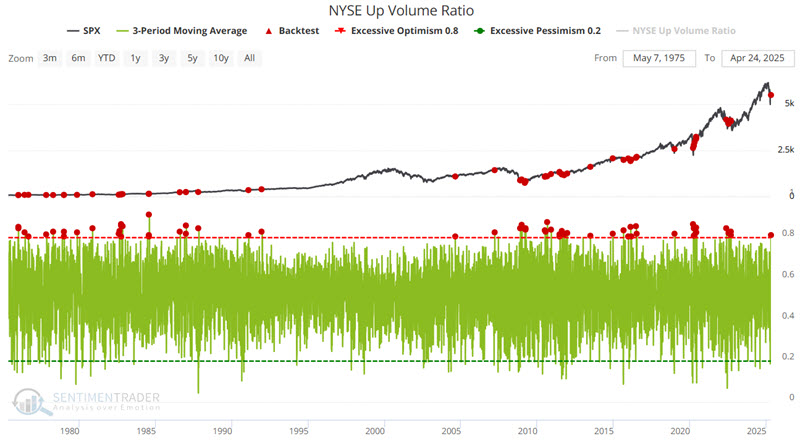
The table below displays S&P performance following the signals highlighted above.
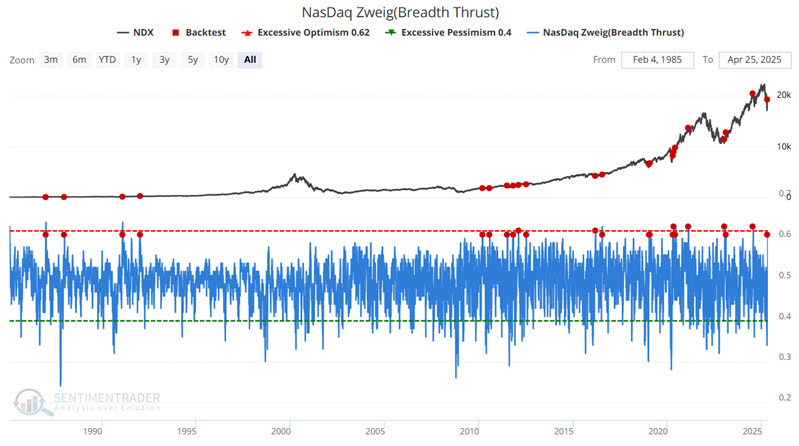
Nasdaq Zweig Thrust triggers a new signal
The Breadth Thrust Indicator is a technical indicator used to identify market momentum. It is computed by calculating the number of advancing issues on an exchange, divided by the total number of issues (advancing + declining) on it, and generating a 10-day exponential moving average of this percentage.
The indicator signals the start of a potential new bull market when it moves from below 40% (indicating an oversold market) to above 61.5% (indicating an overbought market) within any 10-day period.
The chart below highlights all previous signals. The latest occurred on 2025-04-24.
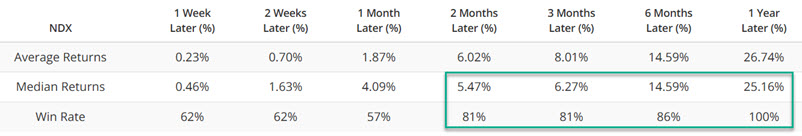
The table below displays Nasdaq 100 results in the year following each previous signal. All signals before 2024 saw the Nasdaq 100 higher twelve months later. However, note that the jury is still out on the 2024-07-16 signal, which is currently underwater.
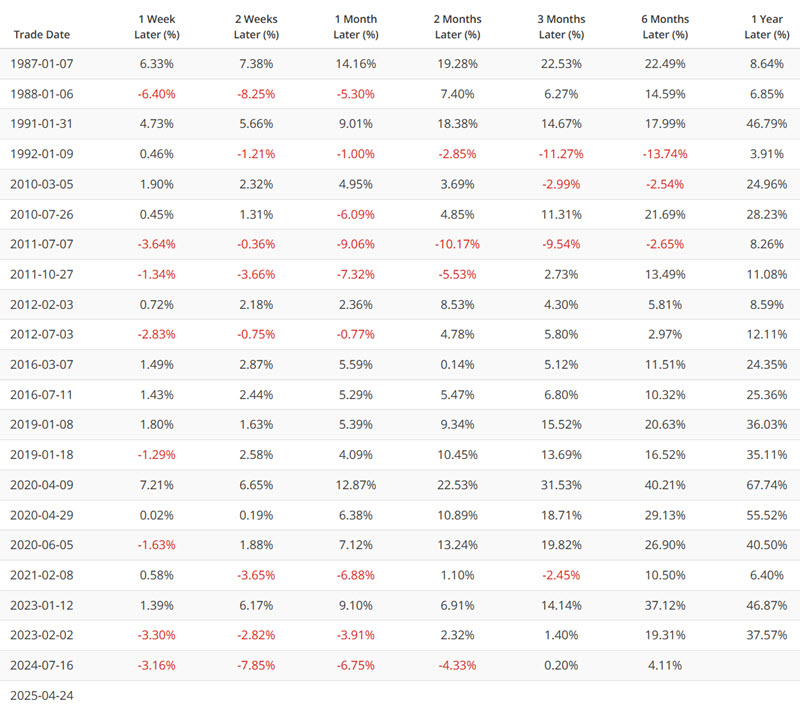
The table below summarizes NDX performance following previous Nasdaq Zweig Thrust signals.
What the research tells us…
As always, no indicator signal or group of indicator signals guarantees a subsequent stock market advance. Nevertheless, history is pretty clear about the typical implications. That said, investors are never relieved of their responsibility to allocate capital responsibly and to manage risk ruthlessly.