Products
SentimenTrader Trading Tools
‍
Backtest Engine
My Trading Toolkit
Correlation Analysis
Seasonality
Market Prediction
Indicators & Data API
‍
Proprietary Indicators & Charts
Market Data API
Strategies & Scanner
‍
50+ Trading Strategies
Smart Stock Scanner
Smart Option Scanner
Research Reports
‍
Research Solutions
Reports Library
Free Resources
Simple Backtest Calculator
Simple Seasonality Calculator
The Kelly Criterion Calculator
Sentiment Geo Map
Public Research Reports
Education
Sentiment Indicators
Technical Indicators
Pricing
Company
About
In the News
Testimonials
Client Success Stories
Contact
Log inLoginSign up
< BACK TO ALL REPORTS

Should we position for a rally after an 18% decline in the S&P 500

Dean Christians
2022-05-17
The S&P 500 has declined by 18.06% since its peak on January 3rd. The drawdown represents the 21st instance of this magnitude since 1929. Let's assess the outlook for the S&P 500 after similar downturns from a 252-day high.

Key points:

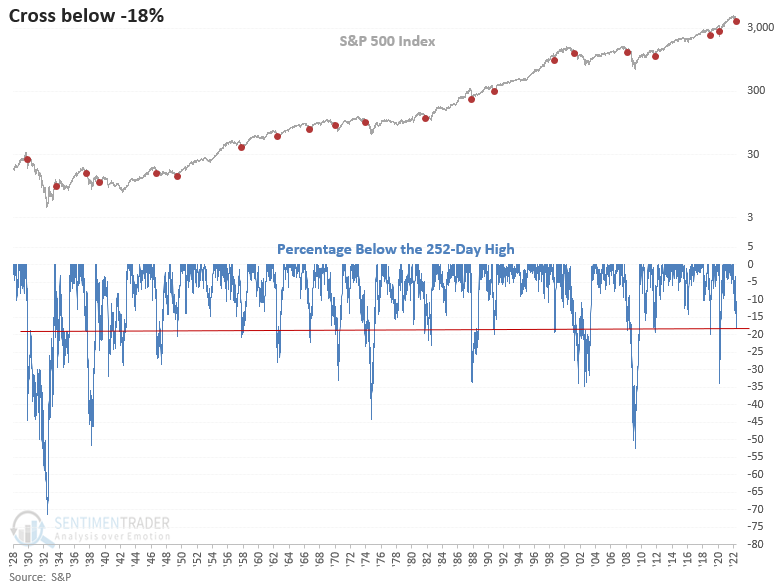
  • The S&P 500 closed down 18% from its 252-day high last week
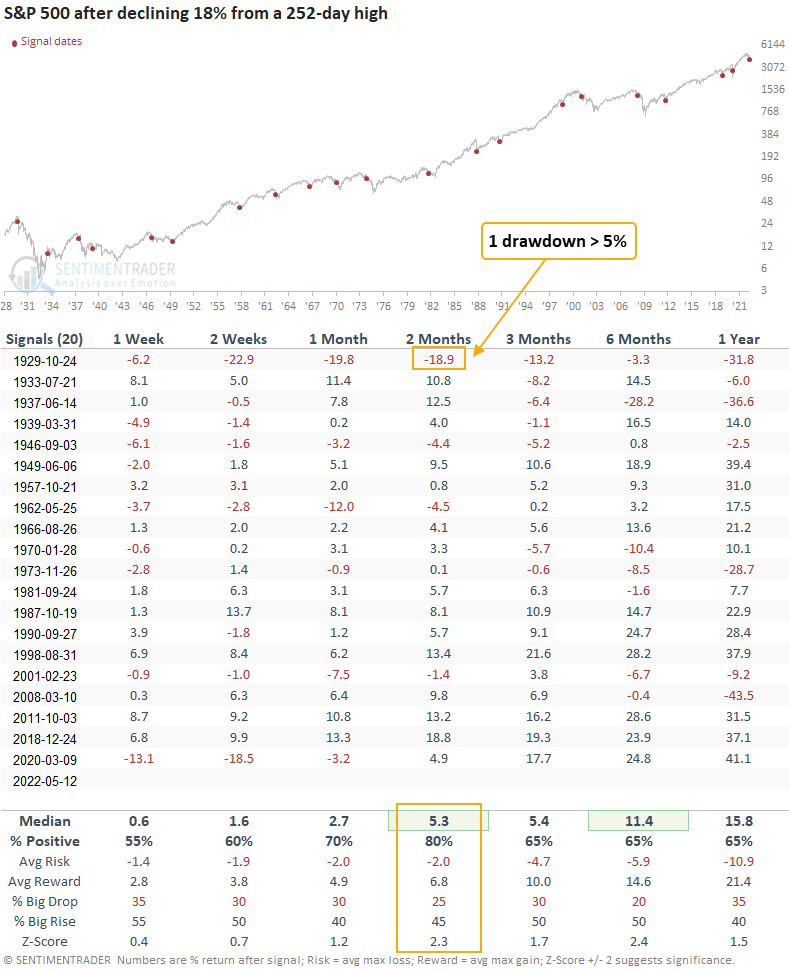
  • After similar signals, the index closed higher 80% of the time 2 months later
  • Instances that stopped short of a 20% decline show even better results

What happens when the S&P 500 declines by 18% from a high?

Let's assess the outlook for the S&P 500 after the index closes down 18% from a 252-day high. I will include a reset that requires the index to close within 1% of a new high before a signal can trigger again. The reset screens out duplicates and identifies the first cross.

Similar signals preceded positive returns 80% of the time

This study generated a signal 20 other times over the past 93 years. After the others, S&P 500 future returns, win rates, and risk/reward profiles look solid across almost all time frames. Suppose a rally develops that eventually becomes a bear market bounce. In that case, the 2-month time frame provides a pretty good window of opportunity whereby we could exit a trade. Except for the 1929 signal, drawdowns were minimal.

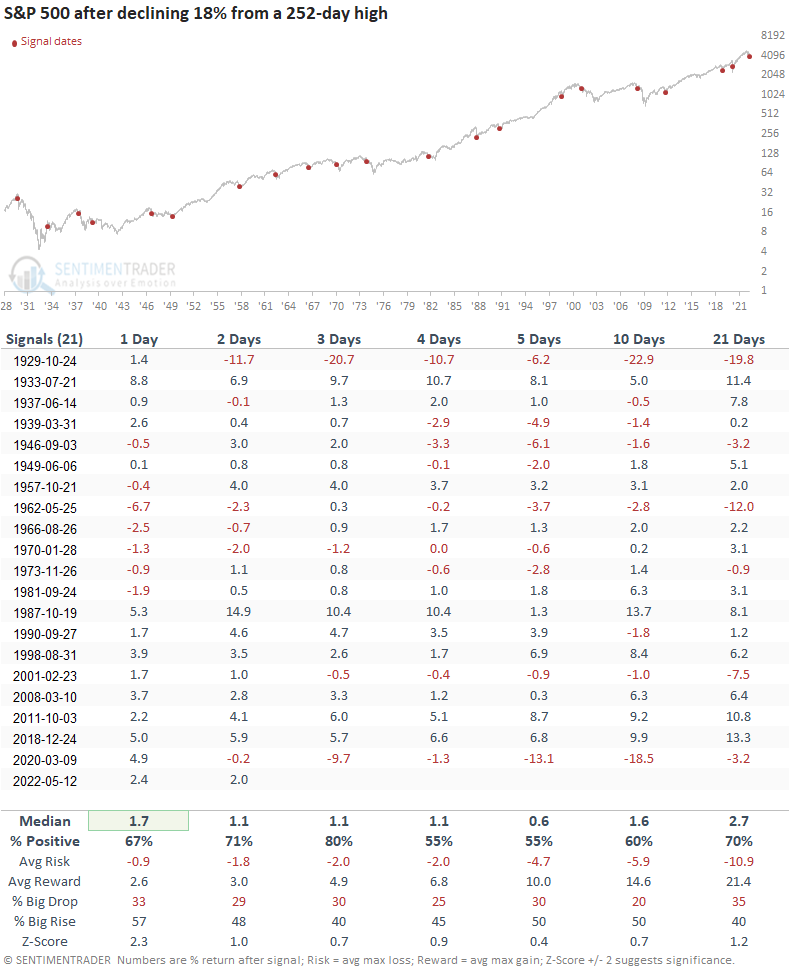
The short-term outlook table provides a strong case for an immediate bounce

S&P 500 future returns, win rates, and risk/reward profiles look pretty good in the 1-3 day time frames, especially the 3-day win rate. With S&P futures up significantly as I write my note, the odds of adding to the win rate in the 3-day window look pretty good.

Suppose I create an exit signal for the study that sells when the index crosses below 20% or when 42 trading days expire, whichever comes first. In that case, we see that 40% of the instances never crossed below -20% in the first 2 months. i.e., a multi-month rally commenced without going from -18% to -20%.

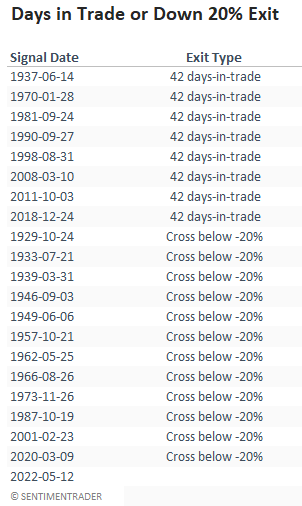
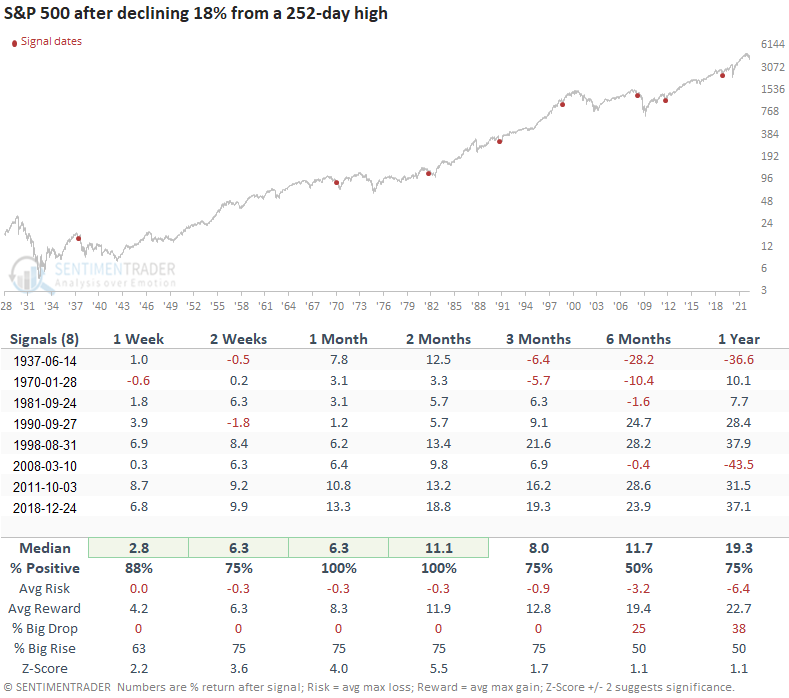
Signals that made it 42 days without the S&P 500 going from -18 to -20%

If we look at the instances that never closed down 20% within the first 2 months of a signal, we see a very compelling case for a multi-month rally. Even the 1937 and 2008 signals provided a window of opportunity.

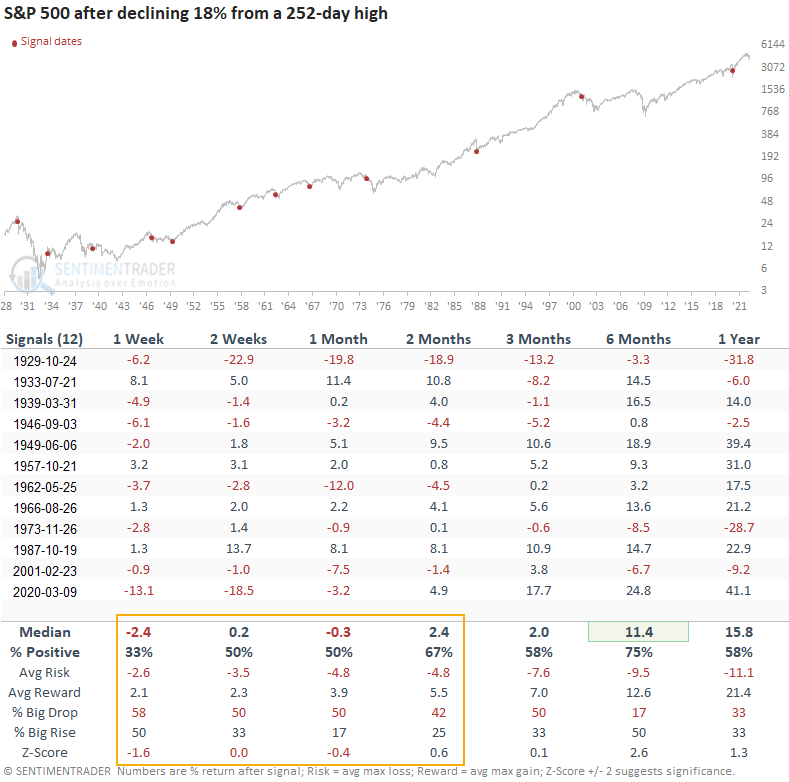
Signals that dropped from -18% to -20% in the first 42 days

The instances where the S&P 500 kept falling and closed down 20% within the first 42 days of the signal show a significantly more muted response across the first few months. The line in the sand at -20% matters.

What the research tells us...

The 18% decline in the S&P 500 provides a window of opportunity for a multi-month rally. Similar setups to what we're seeing now have preceded positive gains, especially in the 2-month time frame. If the index can avoid closing down 20% in the next few months, which is a big question mark, the odds of a multi-month rally improve dramatically.

PRODUCTS
SentimenTrader
Trading Tools
Indicators & Data API
‍
Strategies & Scanner
‍
Research Reports
FREE
RESOUrCES
Simple Backtest
Calculator
Simple Seasonality
Calculator
The Kelly Criterion
Calculator
Sentiment Geo Map
‍
Public Research Reports
‍
Education
Sentiment Indicators
‍
Technical Indicators
‍
Pricing
Bundle pricing
‍
FAQ
‍
Announcements
‍
COMPANY
‍
About
‍
In the News
‍
Testimonials
‍
Client Success Stories
CONTACT
‍
General Inquiries
‍
Media Inquiries
‍
Financial Professionals Inquiries
‍
© 2026 Sundial Capital Research Inc. All rights reserved.
Setsail Marketing
TermsPrivacyAffiliate Program
Risk Disclosure: The information and tools provided are for research and analytical purposes only and are not intended as investment advice. Market analysis involves uncertainty, and outcomes may differ from expectations. Users should conduct their own due diligence and consider their individual circumstances before making any financial decisions. Past performance is not necessarily indicative of future results.

Hypothetical Performance Disclosure: Hypothetical performance results have many inherent limitations, some of which are described below. No representation is being made that any account will or is likely to achieve profits or losses similar to those shown; in fact, there are frequently sharp differences between hypothetical performance results and the actual results subsequently achieved by any particular trading program. One of the limitations of hypothetical performance results is that they are generally prepared with the benefit of hindsight. In addition, hypothetical trading does not involve financial risk, and no hypothetical trading record can completely account for the impact of financial risk of actual trading. for example, the ability to withstand losses or to adhere to a particular trading program in spite of trading losses are material points which can also adversely affect actual trading results. There are numerous other factors related to the markets in general or to the implementation of any specific trading program which cannot be fully accounted for in the preparation of hypothetical performance results and all which can adversely affect trading results.

Testimonial Disclosure: Testimonials appearing on this website may not be representative of other clients or customers and is not a guarantee of future performance or success.