Products
SentimenTrader Trading Tools
‍
Backtest Engine
My Trading Toolkit
Correlation Analysis
Seasonality
Market Prediction
Indicators & Data API
‍
Proprietary Indicators & Charts
Market Data API
Strategies & Scanner
‍
50+ Trading Strategies
Smart Stock Scanner
Smart Option Scanner
Research Reports
‍
Research Solutions
Reports Library
Free Resources
Simple Backtest Calculator
Simple Seasonality Calculator
The Kelly Criterion Calculator
Sentiment Geo Map
Public Research Reports
Education
Sentiment Indicators
Technical Indicators
Pricing
Company
About
In the News
Testimonials
Client Success Stories
Contact
Log inLoginSign up
< BACK TO ALL REPORTS

Should we catch the falling knife in Hong Kong

Dean Christians
2022-03-15
The 15-day rate of change for the Hang Seng Index shows a massive downward shift in price momentum. Similar signals to what we're seeing now have preceded solid returns, win rates, and risk/reward profiles in the near term.

Key points:

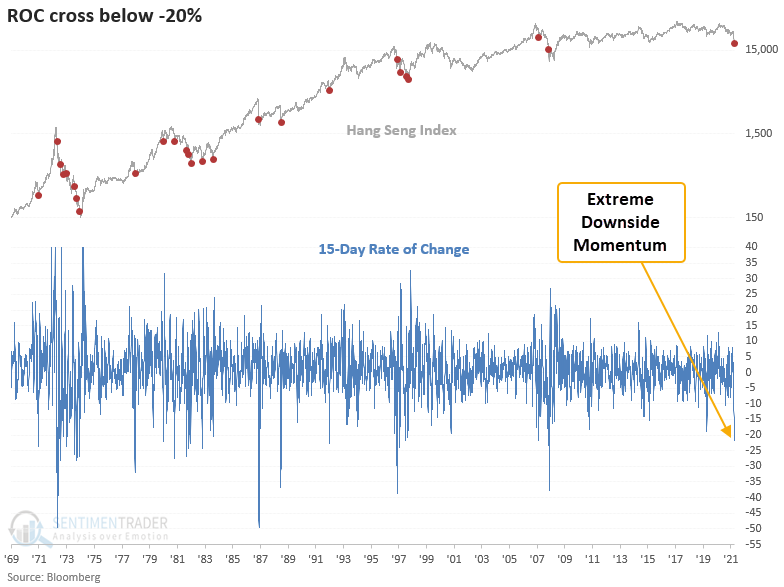
  • A short-term gauge of price momentum shows a sharp contraction in Hong Kong stocks
  • The 15-day rate of change for the Hang Seng Index declined by more than 21%
  • Similar momentum signals show favorable near term results

What happens when short-term price momentum accelerates to the downside

Let's conduct a study to assess the outlook for the Hang Seng Index when the 15-day rate of change declines by more than 20%. I will use a reset above zero on the rate of change to screen out duplicates.

The current downside momentum in the Hang Seng Index was last seen in October 2008.

Similar episodes of negative momentum suggest a near term bounce

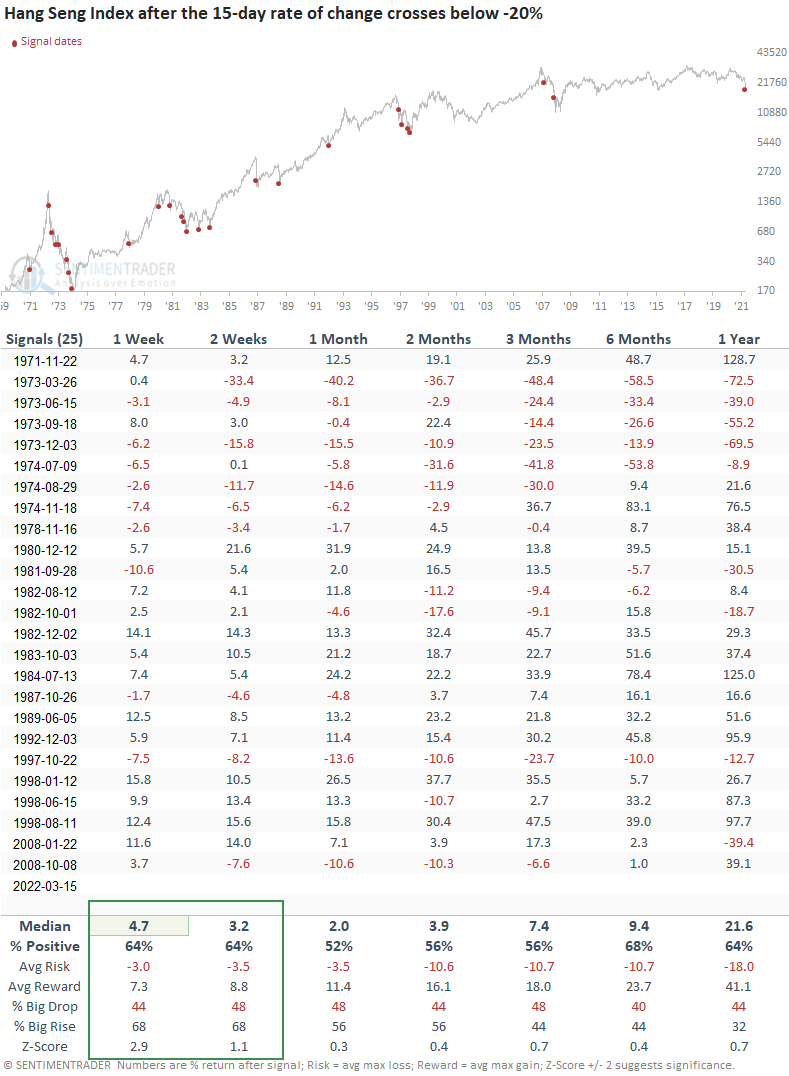
This signal has triggered 25 other times over the past 51 years. After the others, the Hang Seng Index shows solid returns, win rates, and risk/reward profiles in the 1 & 2 week time frames. The 1-week window looks pretty compelling, especially the more recent signals, which shows 12 out of 14 winners since 1982. Momentum signals like this are tricky because it's difficult to distinguish between a one-and-done versus the first in a series like the Asian contagion.

Don't catch the falling knife

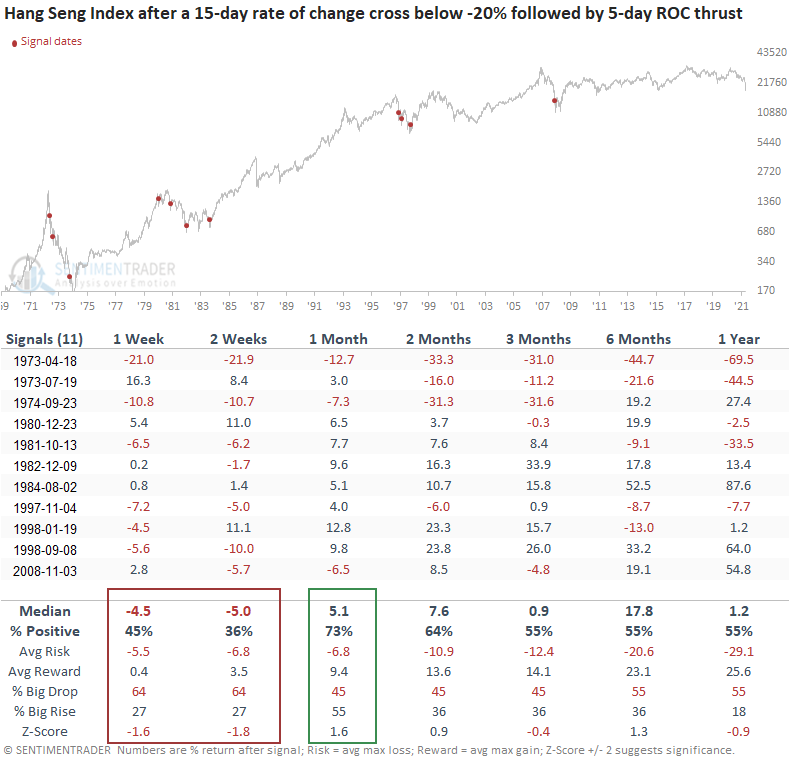
Let's see if we would be better off if we waited for a burst of positive momentum before buying the dip. The goal is to find a better risk/reward profile for a mean reversion trade. After running an optimization process, the test identified a 5-day rate of change of >= 14% within 25 days of the 15-day rate of change cross below -20%. I included the count condition because I wanted to ensure that the thrust signal was associated with the negative momentum in our original study. The optimal days-in-trade exit signal returned 25 sessions. The 25-day exit shows 9 winning trades with 2 losses for an 82% win rate.

The outlook table shows that once the momentum signal triggers, one would be better suited by initiating a trade after some backing and filling or in multiple tranches.

What the research tells us...

When the Hang Seng Index shows a massive downward shift in price momentum, the adverse price action can provide a potential near-term mean reversion edge. Similar signals to what we're seeing now have preceded solid returns, win rates, and risk/reward profiles in the near term, especially the 1-week time frame. If we wait for price momentum to turn up, we can improve the outlook for a longer-duration trade once the dust settles.

PRODUCTS
SentimenTrader
Trading Tools
Indicators & Data API
‍
Strategies & Scanner
‍
Research Reports
FREE
RESOUrCES
Simple Backtest
Calculator
Simple Seasonality
Calculator
The Kelly Criterion
Calculator
Sentiment Geo Map
‍
Public Research Reports
‍
Education
Sentiment Indicators
‍
Technical Indicators
‍
Pricing
Bundle pricing
‍
FAQ
‍
Announcements
‍
COMPANY
‍
About
‍
In the News
‍
Testimonials
‍
Client Success Stories
CONTACT
‍
General Inquiries
‍
Media Inquiries
‍
Financial Professionals Inquiries
‍
© 2026 Sundial Capital Research Inc. All rights reserved.
Setsail Marketing
TermsPrivacyAffiliate Program
Risk Disclosure: The information and tools provided are for research and analytical purposes only and are not intended as investment advice. Market analysis involves uncertainty, and outcomes may differ from expectations. Users should conduct their own due diligence and consider their individual circumstances before making any financial decisions. Past performance is not necessarily indicative of future results.

Hypothetical Performance Disclosure: Hypothetical performance results have many inherent limitations, some of which are described below. No representation is being made that any account will or is likely to achieve profits or losses similar to those shown; in fact, there are frequently sharp differences between hypothetical performance results and the actual results subsequently achieved by any particular trading program. One of the limitations of hypothetical performance results is that they are generally prepared with the benefit of hindsight. In addition, hypothetical trading does not involve financial risk, and no hypothetical trading record can completely account for the impact of financial risk of actual trading. for example, the ability to withstand losses or to adhere to a particular trading program in spite of trading losses are material points which can also adversely affect actual trading results. There are numerous other factors related to the markets in general or to the implementation of any specific trading program which cannot be fully accounted for in the preparation of hypothetical performance results and all which can adversely affect trading results.

Testimonial Disclosure: Testimonials appearing on this website may not be representative of other clients or customers and is not a guarantee of future performance or success.