
Should we buy the oversold condition

Key points:
- 52-Week lows for NYSE issues surged above 30%
- More than 50% of S&P 500 stocks are down 20% or more from a 252-day high
- The number of sub-industry groups with a positive 1-year rolling return is less than 32%
- After similar signals, the probabilities favor a market bounce in the next few days
How do current market conditions compare to history?
Let's create a composite with 3-time series that I've shared in recent notes to compare the current market conditions with similar circumstances throughout history. The goal is to assess whether the almost 20% decline is ripe for a mean-reversion bounce. The composite will use the following time series with threshold levels based on the closing values as of Thursday, May 12th.
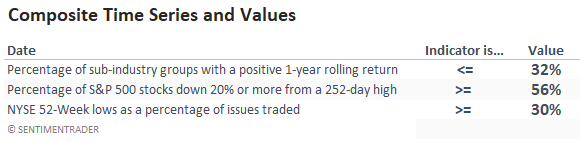
So, when each indicator value achieves its respective threshold level in a trailing 5-day lookback period, the composite count will increase to 3. The study will buy the S&P 500 when the composite count crosses 2.99.
To be clear, this is not a trading model that I monitor. I'm comparing the closing value of 3 market breadth indicators to assess whether we can find an edge that would suggest the market can bounce from an oversold condition.
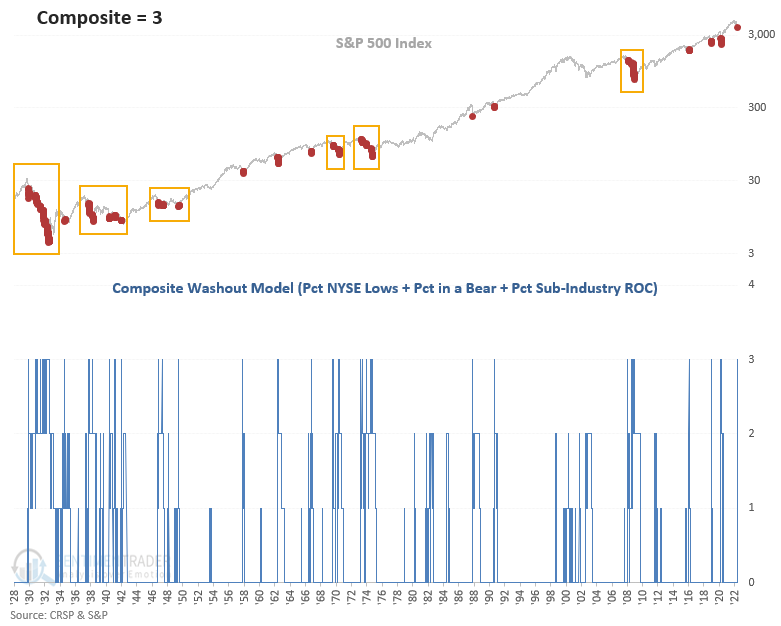
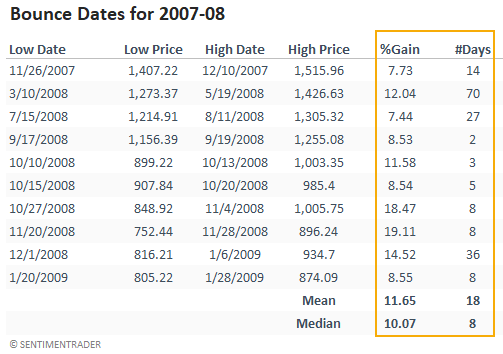
Do we see a one-and-done oversold condition or a persistently oversold environment like 1929-32, 1937-42, 1946-49, 1973-74, and 2007-08? A market that remains oversold is often associated with a recession-driven bear.
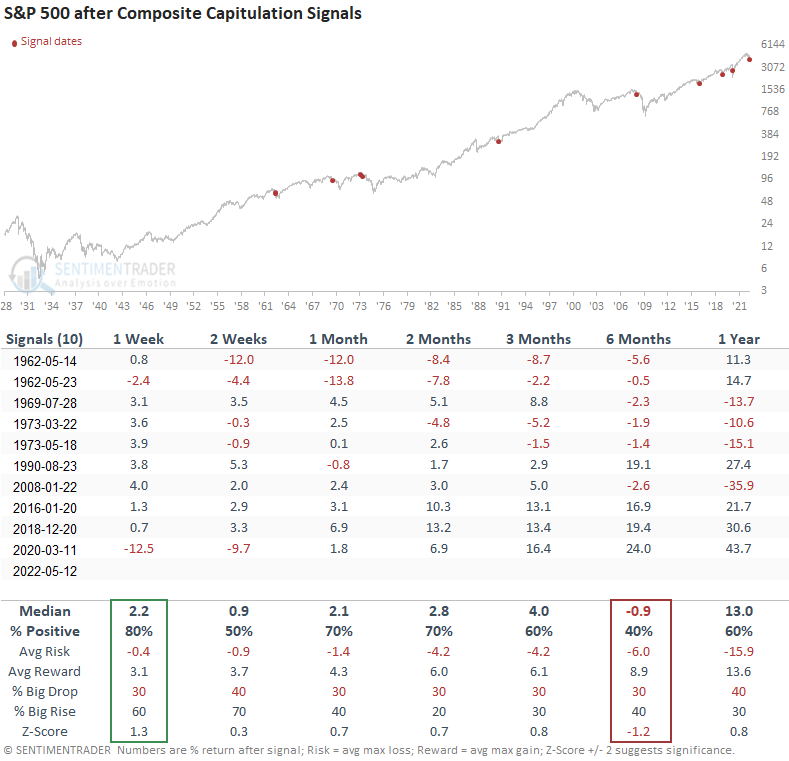
Similar signals preceded a more favorable short-term outlook
This study generated a signal 48 other times over the past 93 years. After the others, S&P 500 future returns, win rates, and risk/reward profiles look somewhat tepid in the 2-8-week range and unfavorable in the longer-duration time frames. The 1-week window looks the best, with a decent z-score. Given the 1-week results, let's apply the signals to a short-term outlook table.
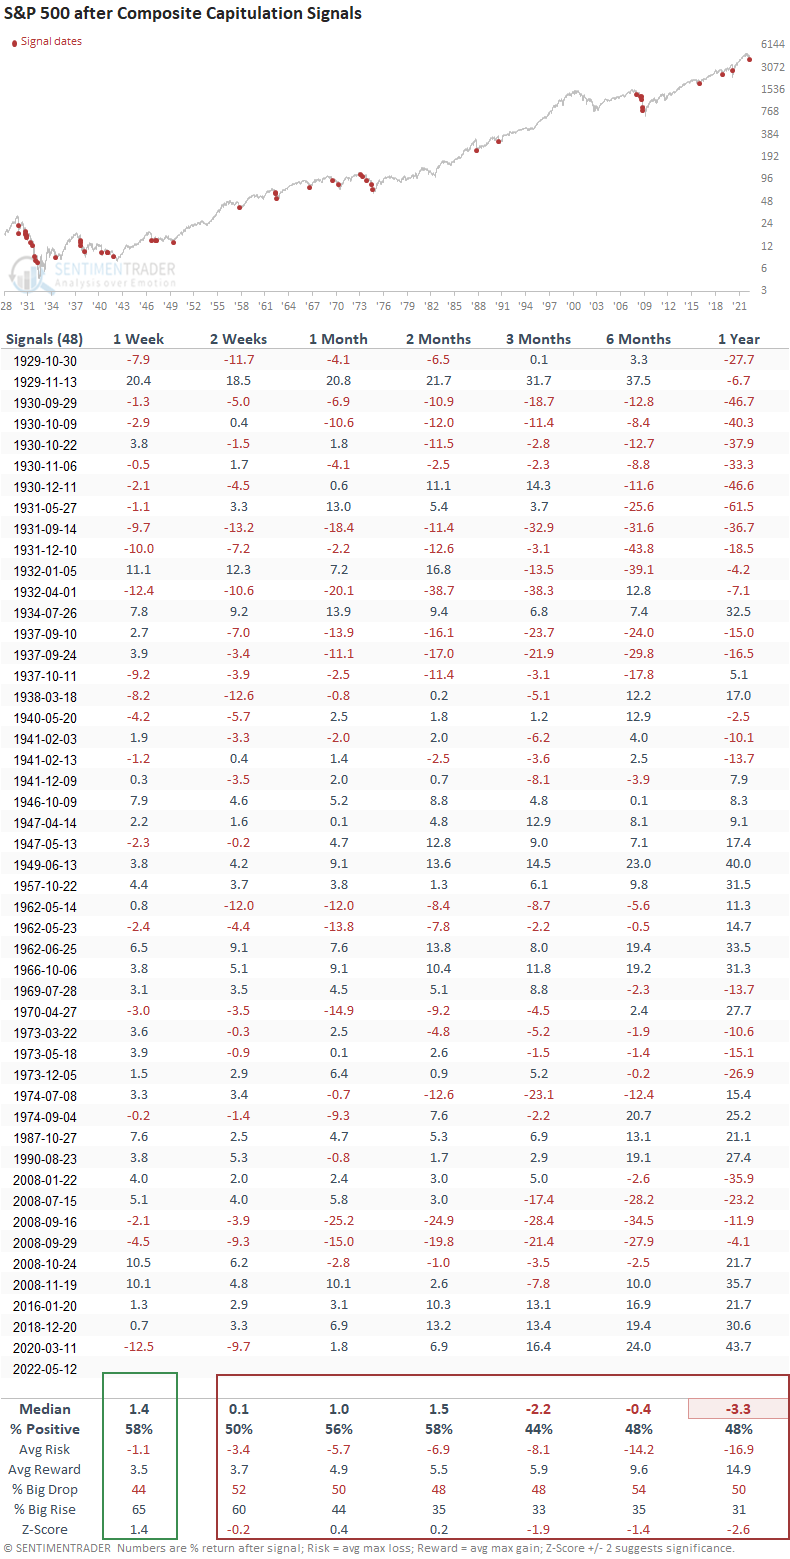
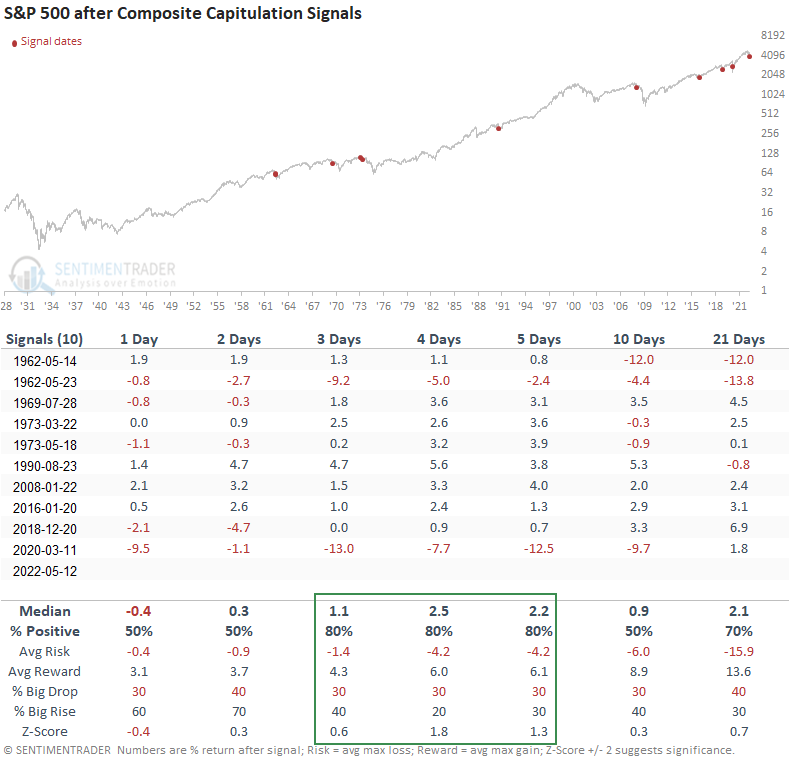
The short-term outlook table suggests a bounce could materialize in the next few days
S&P 500 future returns, win rates, and risk/reward profiles look pretty good in the 2-4 day time frames, especially the 4-day window. We need to remember bear markets often see sharp and short rallies.
Bear market rallies are sharp and short in duration
While the S&P 500 did not fall below the arbitrary bear market level of 20%, I think it's safe to say we're in a bear market. So, one should not be surprised to see the favorable 1-week results in our study, especially given the statistics in this table.
Signals that occurred when the S&P 500 was down 20% or less
Let's add some context to the oversold condition. I will keep the original signal parameters but now identify instances that occurred when the S&P 500 was down 20% or less, which is the case now. This study generated a signal 10 other times over the past 60 years. After the others, S&P 500 future returns, win rates, and risk/reward profiles look better on a short to medium-term basis except for the 6-month window. Once again, the 1-week results look the best.
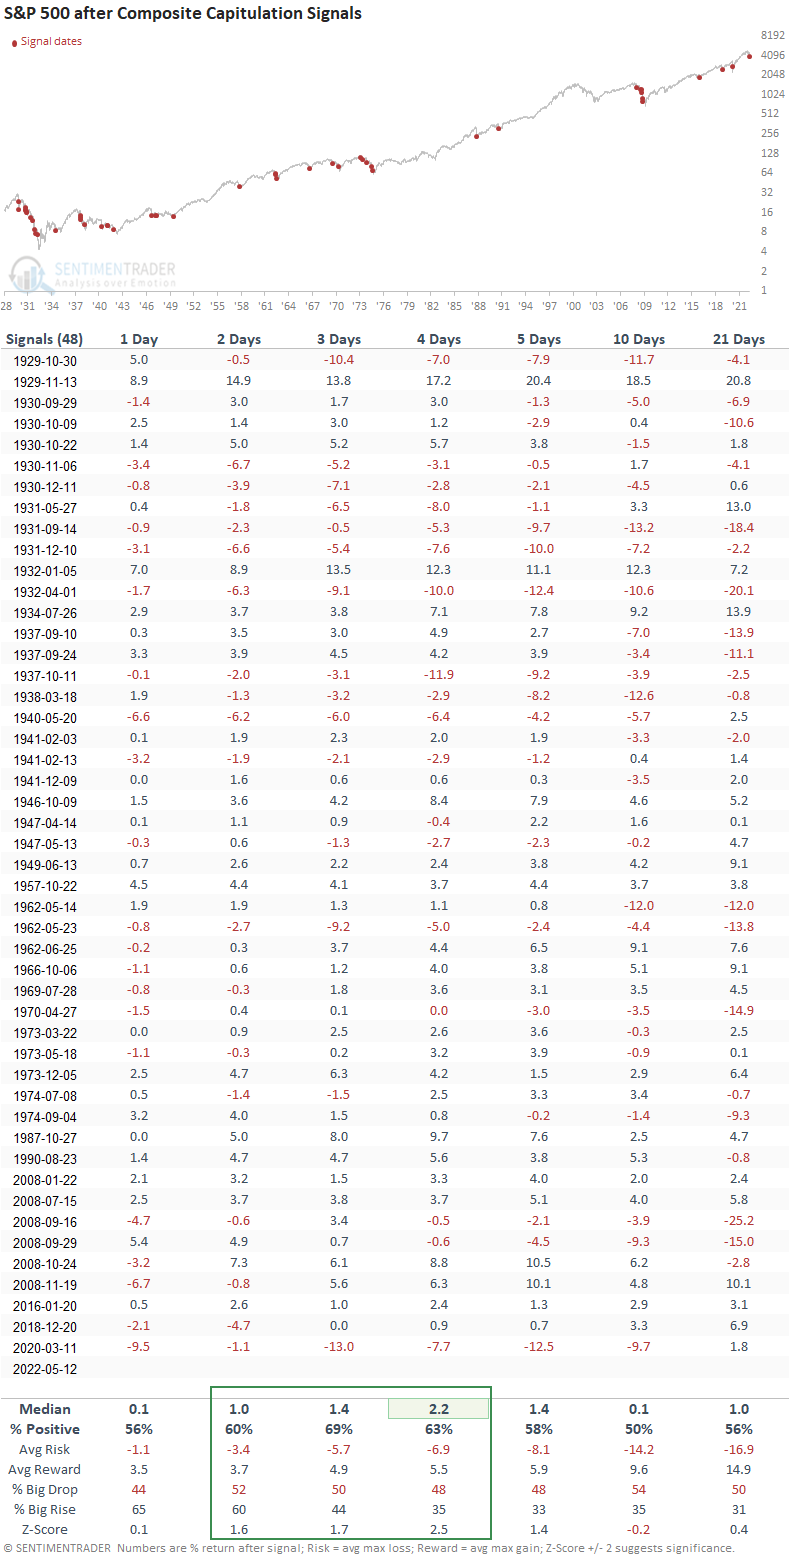
The short-term outlook table provides pretty good odds for a bounce
The 3-5 day time frames look pretty good, especially the win rates.
What the research tells us...
When the market breadth composite score increases to 3, history suggests an oversold market, leading to a mean-reversion bounce. Similar setups to what we're seeing now have preceded positive gains in the short-term, especially the 1-week window. However, we need to be aware of the big picture as the medium and long-term results look unfavorable. If we isolate signals that occurred when the S&P 500 was down 20% or less, the results look better across almost all time frames.
I shared several notes in the last few months that suggest we are in a bear market. However, nothing moves in a straight line forever. History suggests it could be sharp and short if we do get a bounce.