Products
SentimenTrader Trading Tools
‍
Backtest Engine
My Trading Toolkit
Correlation Analysis
Seasonality
Market Prediction
Indicators & Data API
‍
Proprietary Indicators & Charts
Market Data API
Strategies & Scanner
‍
50+ Trading Strategies
Smart Stock Scanner
Smart Option Scanner
Research Reports
‍
Research Solutions
Reports Library
Free Resources
Simple Backtest Calculator
Simple Seasonality Calculator
The Kelly Criterion Calculator
Sentiment Geo Map
Public Research Reports
Education
Sentiment Indicators
Technical Indicators
Pricing
Company
About
In the News
Testimonials
Client Success Stories
Contact
Log inLoginSign up
< BACK TO ALL REPORTS

Should we buy gold after a reversal in price trends

Dean Christians
2022-02-17
A composite trend model for gold reversed from a bearish to a bullish price trend regime. Let's assess the outlook for gold after similar trend changes.

Key points:

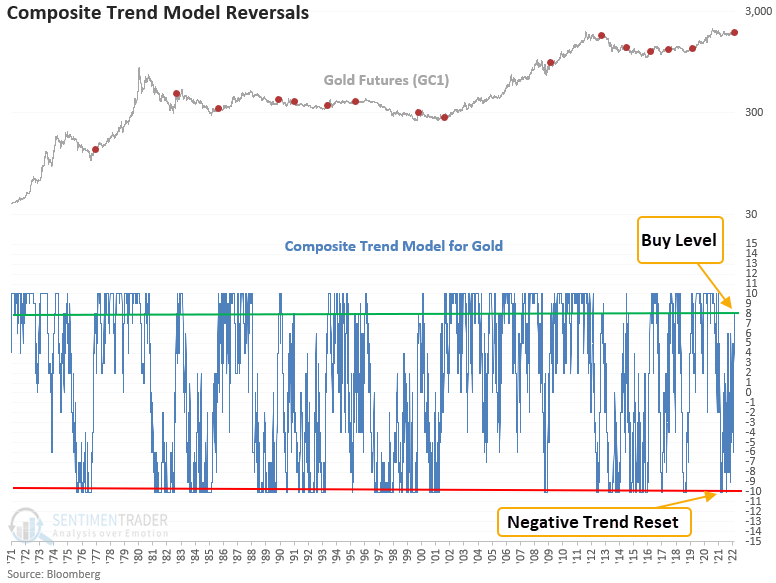
  • A composite trend model for gold shows 8 out of 10 components with a positive trend 
  • The recent change in the composite score comes after 10 out of 10 components showed a negative trend
  • Similar trend score changes preceded weak returns for gold on a medium-term basis

A bearish to a bullish reversal in trend indicators for gold
If I put my subjective technical analysis hat on, I would describe the chart of gold as constructive. The gold bugs describe the current chart setup as a bullish cup and handle pattern. 

A composite trend model for gold recently increased to 8 out of 10 components with a positive trend. The shift comes after 10 out 10 members showed a negative direction. Let's conduct a study to assess the outlook for gold after similar trend score reversals.

Similar signals show weak results on a medium-term basis

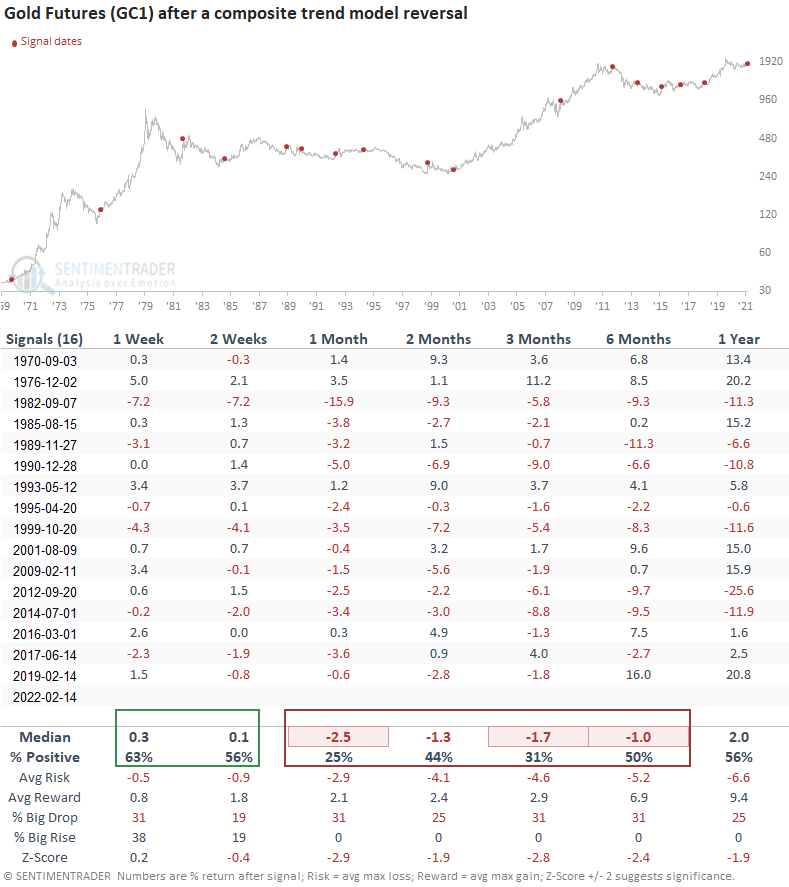
This signal triggered 16 other times over the past 52 years. After the others, Gold future returns, win rates, and risk/reward profiles were underwhelming across all medium-term time frames, especially the 1-month window. The 1-2 week time frames suggest that gold could drift higher, especially given the Russia/Ukraine situation. Even if this time is different, it's unlikely that we would see gold prices zoom higher as 13 out of 16 instances showed a negative return at some point in the first 2 months. The 1976 instance is the only case where gold never looked back.

What would get me more excited about gold

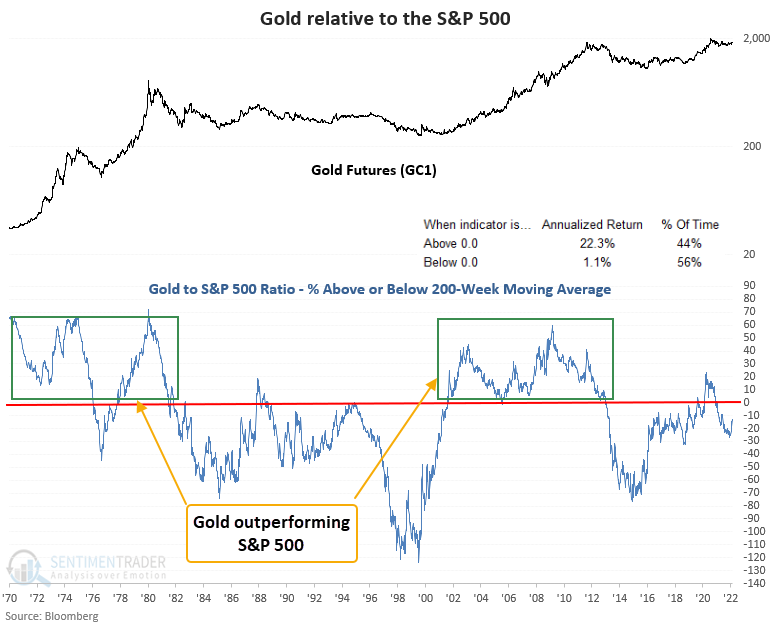
The following chart shows the distance above or below the 200-week moving average for the gold to S&P 500 ratio. If the ratio can climb above the 200-week average for a sustained period, that would be a significantly more positive development.

What the research tells us...

The reversal in a composite trend model for gold suggests that the commodity could drift higher in the near term, especially given the Russia/Ukraine situation. However, trend reversals for gold have historically shown underwhelming results, win rates, and risk/reward profile on a medium-term basis. If the gold to S&P 500 ratio can climb above the 200-week average, I'm on board.

PRODUCTS
SentimenTrader
Trading Tools
Indicators & Data API
‍
Strategies & Scanner
‍
Research Reports
FREE
RESOUrCES
Simple Backtest
Calculator
Simple Seasonality
Calculator
The Kelly Criterion
Calculator
Sentiment Geo Map
‍
Public Research Reports
‍
Education
Sentiment Indicators
‍
Technical Indicators
‍
Pricing
Bundle pricing
‍
FAQ
‍
Announcements
‍
COMPANY
‍
About
‍
In the News
‍
Testimonials
‍
Client Success Stories
CONTACT
‍
General Inquiries
‍
Media Inquiries
‍
Financial Professionals Inquiries
‍
© 2026 Sundial Capital Research Inc. All rights reserved.
Setsail Marketing
TermsPrivacyAffiliate Program
Risk Disclosure: The information and tools provided are for research and analytical purposes only and are not intended as investment advice. Market analysis involves uncertainty, and outcomes may differ from expectations. Users should conduct their own due diligence and consider their individual circumstances before making any financial decisions. Past performance is not necessarily indicative of future results.

Hypothetical Performance Disclosure: Hypothetical performance results have many inherent limitations, some of which are described below. No representation is being made that any account will or is likely to achieve profits or losses similar to those shown; in fact, there are frequently sharp differences between hypothetical performance results and the actual results subsequently achieved by any particular trading program. One of the limitations of hypothetical performance results is that they are generally prepared with the benefit of hindsight. In addition, hypothetical trading does not involve financial risk, and no hypothetical trading record can completely account for the impact of financial risk of actual trading. for example, the ability to withstand losses or to adhere to a particular trading program in spite of trading losses are material points which can also adversely affect actual trading results. There are numerous other factors related to the markets in general or to the implementation of any specific trading program which cannot be fully accounted for in the preparation of hypothetical performance results and all which can adversely affect trading results.

Testimonial Disclosure: Testimonials appearing on this website may not be representative of other clients or customers and is not a guarantee of future performance or success.