
Should we be bottom fishing in the Eurozone

Key points:
- The number of Eurozone ETFs outperforming the S&P 500 on a YTD basis contracted sharply
- Price trend indicators for Eurozone countries show a significant reversal from positive to negative
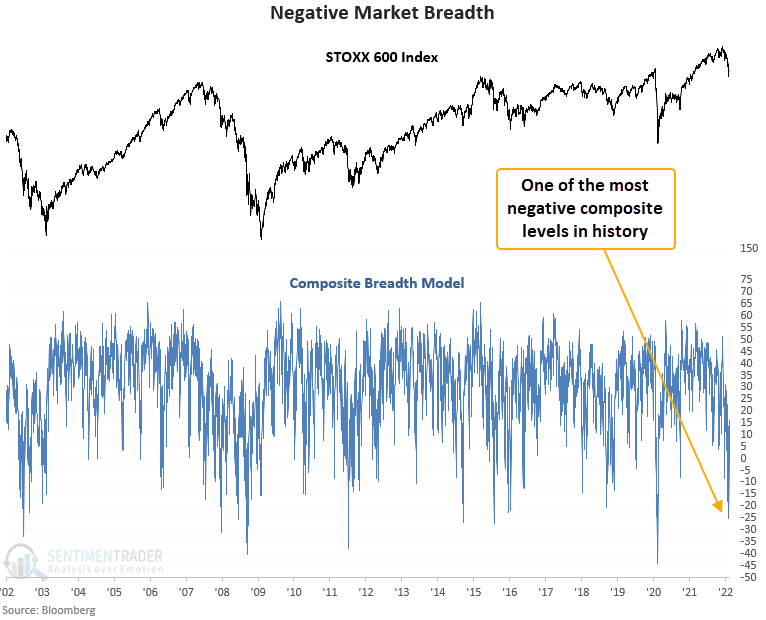
- A breadth composite for the STOXX Europe 600 Index shows a considerable plunge
- Internal and external index trend conditions suggest medium-term caution
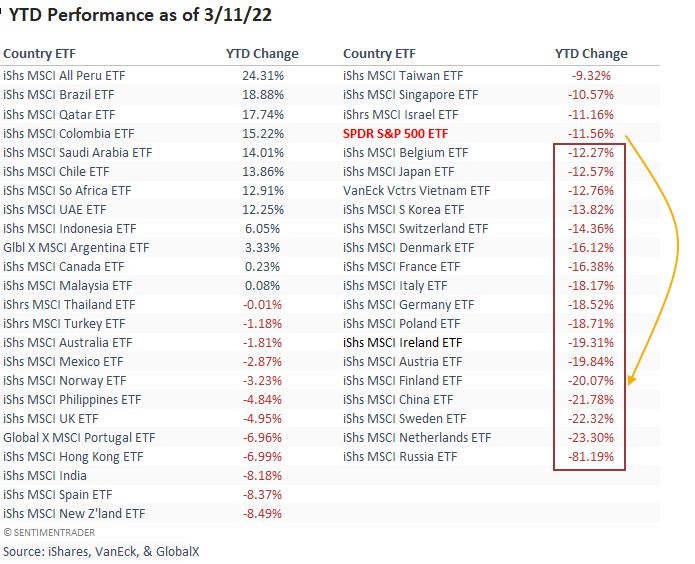
Eurozone Indexes outperforming the S&P 500 show a meaningful drop
In my last global index update on 2/18/22, 67% of the Eurozone country ETFs that I track outperformed the S&P 500 on a YTD basis. If we fast forward to today, the number of countries exceeding the S&P 500 stands at 27%. The significant deterioration should not be a surprise given the region's proximity to the Russia/Ukraine conflict and its dependence on certain commodities from the countries mentioned above.
Price trend indicators are overwhelmingly negative for Eurozone indexes
Suppose I sort the Country table by the trend score column. In that case, it shows zero Eurozone countries with a positive trend score. The Pandemic crash is the last time this series registered a zero reading. Let's conduct a study to assess the outlook for the region when the percentage of Eurozone countries with a positive trend score falls to zero. I will use a reset above 99% to identify the first instance and screen out repeats.
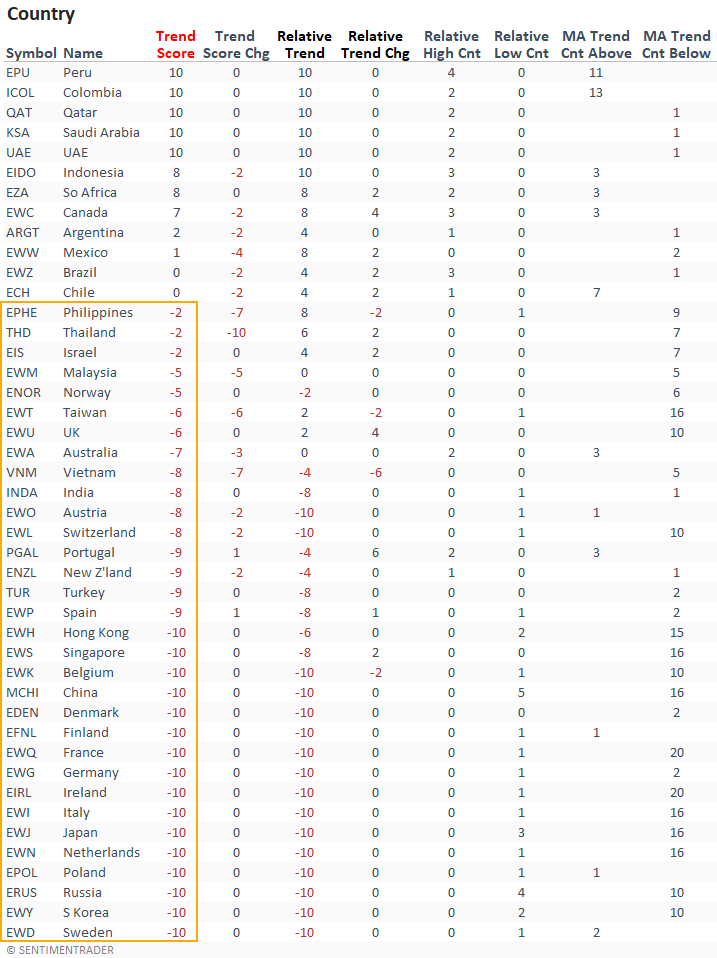
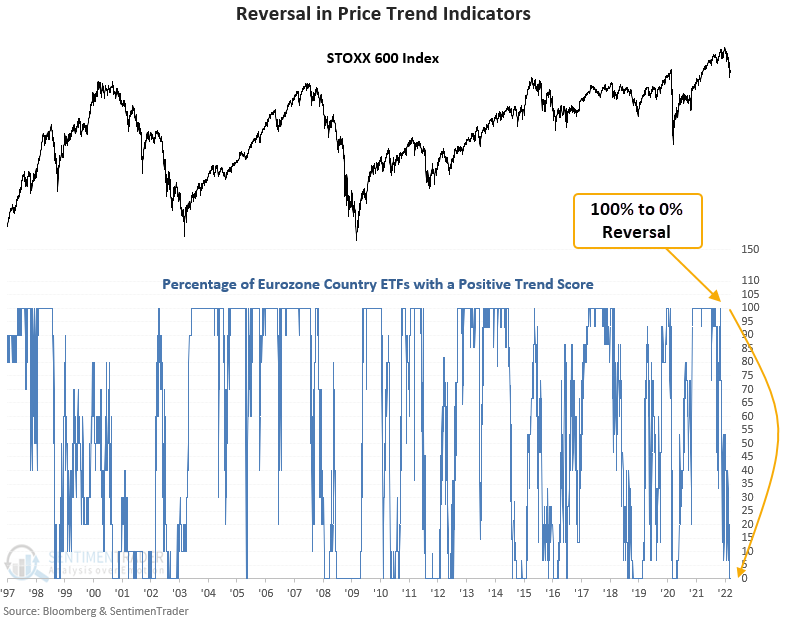
Eurozone indexes show a significant reversal in price trends
Applying a composite trend model to each Eurozone ETF shows all 15 countries with a positive score as recently as November 2021. Today, that same basket shows zero ETFs with a positive trend score. Please click here to read the concept note for the trend score calculation.
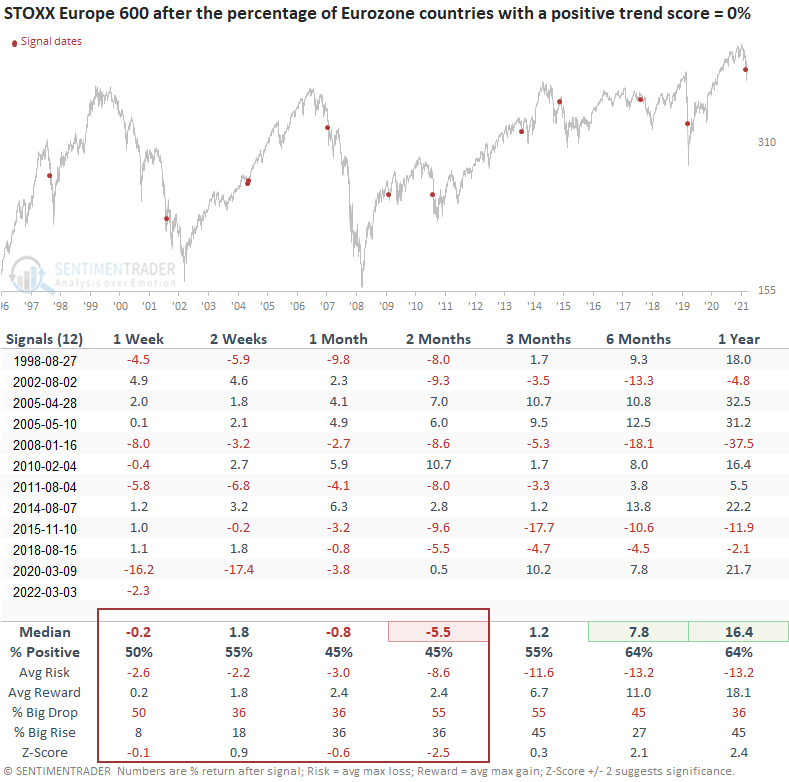
A significant shift in price trends suggests weak results on a short and medium-term basis
This signal has triggered 12 other times over the past 24 years. After the others, the STOXX 600 Index shows weak returns and unfavorable win rates across most short and medium-term time frames. While the 2-week window suggests there's a chance for a bounce, the 2-month time frame indicates it may not be worth playing a mean-reversion bounce. The signal shows a lower close in 10 out of 13 instances at some point in the first 2 months.
A composite market breadth model shows significant deterioration
The internal condition of the STOXX Europe 600 Index registered one of the weakest readings in history last week when a composite breadth model plunged below -25%. Let's conduct a study to assess the outlook for the STOXX Europe 600 Index when the composite breadth model crosses below -25%. I will use a reset above 0% to identify the first instance and screen out repeats.
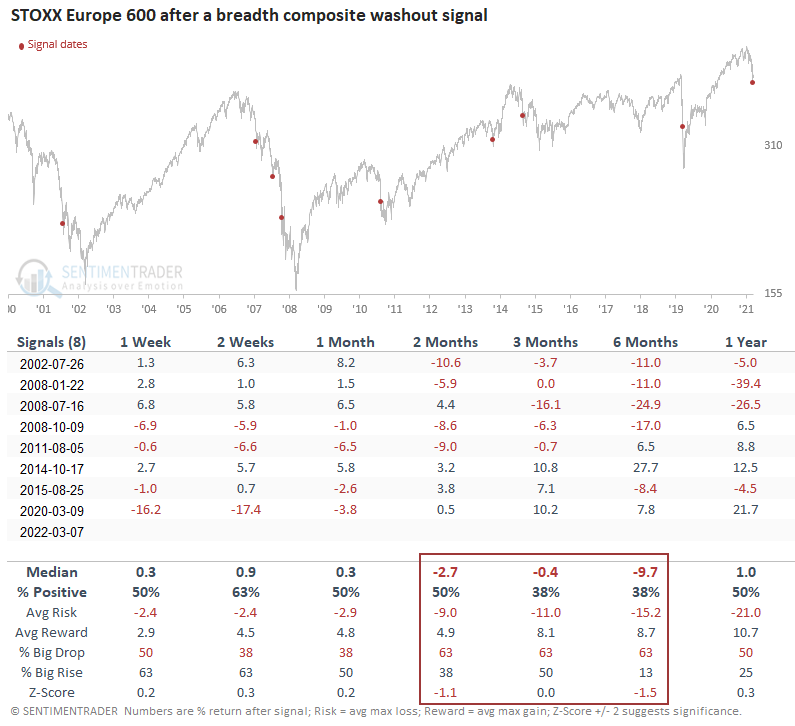
A significant plunge in market breadth suggests weak results on a medium-term basis
This signal triggered 8 other times over the past 20 years. After the others, the STOXX 600 Index shows weak returns and unfavorable win rates in the 2-6 month time frames. The 2-week window suggests there's a chance for a bounce. However, I would keep a short leash on any mean reversion play. The study sample size is small.
What the research tells us...
Internal and external price trends have turned decidedly negative for Eurozone stocks. While weak, they can get weaker. Similar setups to what we're seeing now have preceded negative returns for the STOXX Europe 600 Index on a medium-term basis. Both studies suggest the index can bounce in the near term, which appears to be happening now. Remember, V bottoms are rare.