
Short-term Speculation in Two Key Commodities

Key points:
- Commodities as an asset class performed well overall in 2025
- That said, a handful of markets are entering periods of notable historical weakness
- Short-term seasonal periods are absolutely "hit or miss" affairs, so the opportunities in the US Dollar and Unleaded Gas below are only for those traders who understand the risks involved in shorting commodity futures and who are willing to take action to minimize their risk
Commodities are higher in 2025, but near-term weakness is possible
The chart below displays the Bloomberg Commodity Spot Price Index (BCOMSP) versus its 24-month moving average.
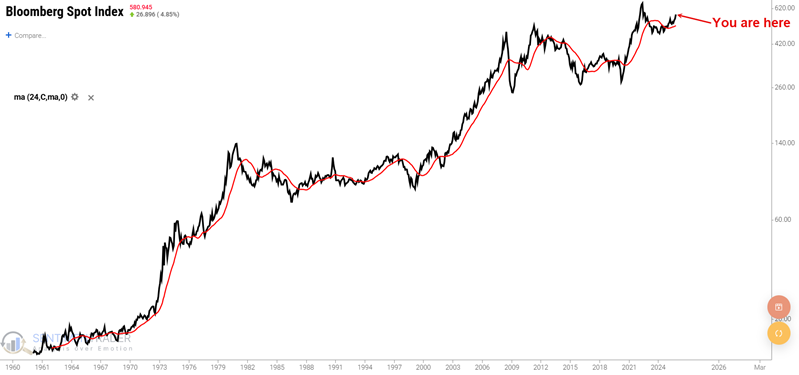
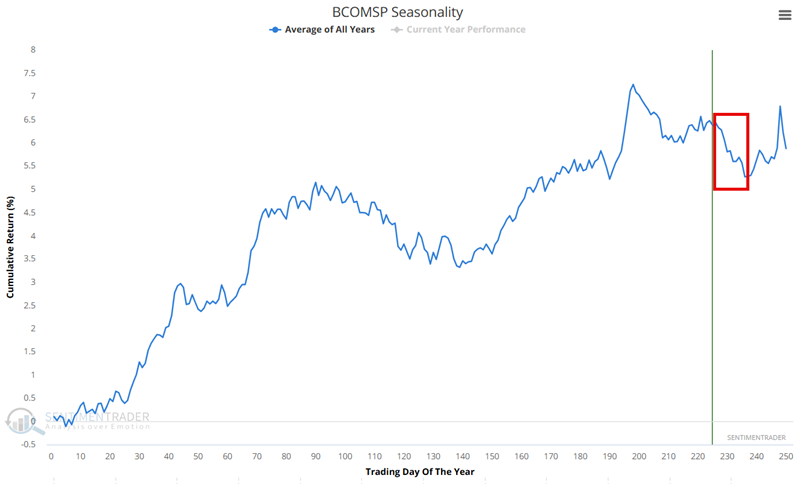
When this broad-based measures of various commodity markets is above its 24-month moving it implies that overall commodities are trending higher. So far, BCOMSP is up x% for 2025. While the overall trend is higher, the chart below, which displays the annual seasonal trend for BCOMSP, suggests the potential for weakness in the very short term. The period highlighted extends from Trading Day of Year (TDY) #226 through #236. For 2025, this period extends from the close on November 24th through the close on December 9th.
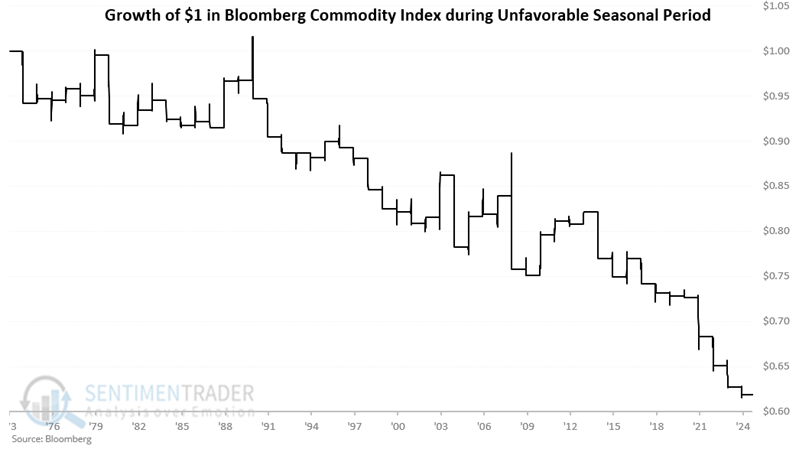
The table below displays the hypothetical growth of $1 invested in the Bloomberg Commodity Spot Price Index only during this period every year since 1974.
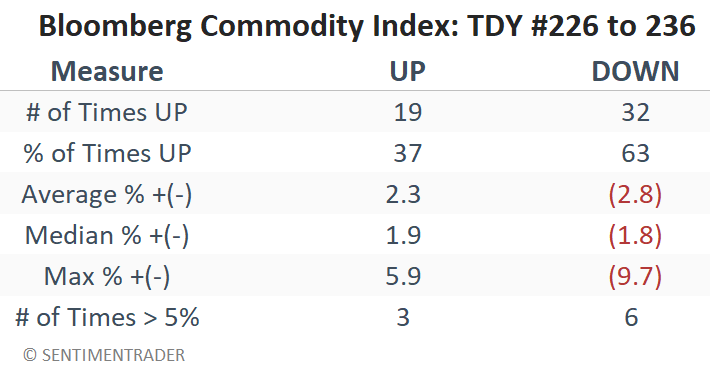
The table below summarizes BCOMSP's performance during this period, spanning the past 52 years.
To be clear, the message here is not that one should short commodities markets across the board. The primary message I take from the data above is that if I am looking to commit capital to bet on a continuation of the recent uptrend in commodity prices, I may want to wait until early December before doing so. I may also be open to considering other opportunities on the short side, such as those below.
The US Dollar may be vulnerable to a reversal
In the chart below, we see that the US Dollar is down about 8% so far for 2025, but has been bouncing higher since June.
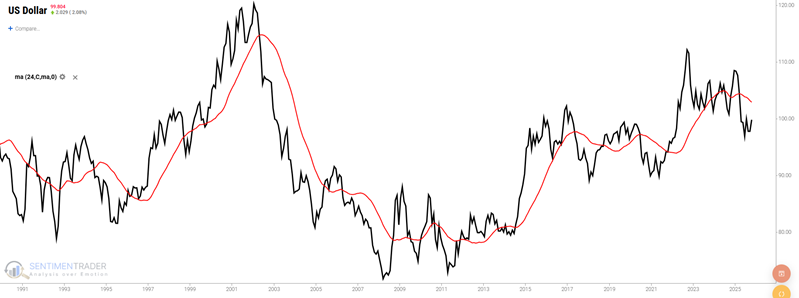
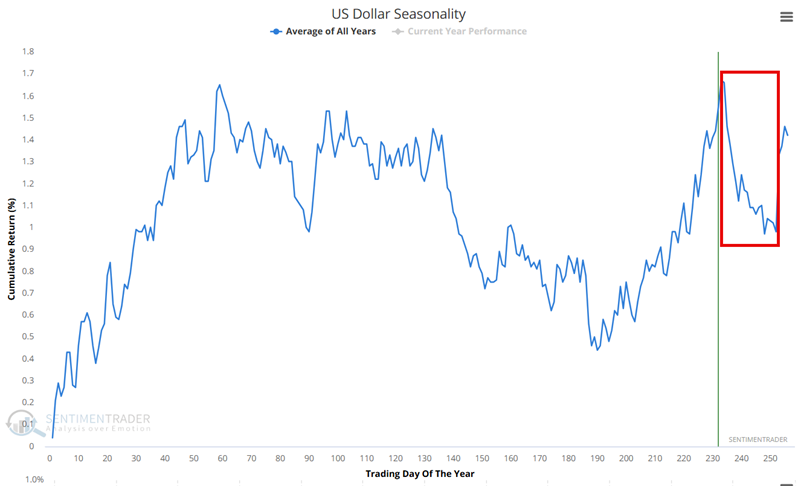
History, however, suggests that now is not the time to chase the advance in the Dollar. The Annual Seasonal Trend chart for the US Dollar highlights a period that extends from Trading Day of the Year (TDY) #234 through TDY #252. For 2025, this period extends from November 25th through December 19th.
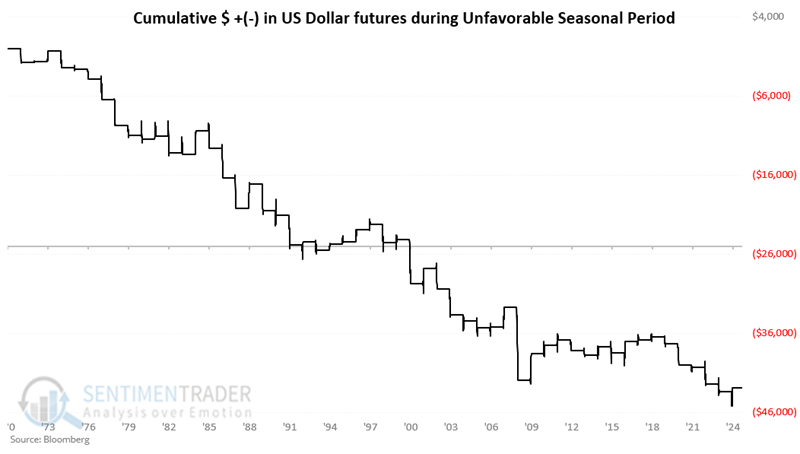
The chart below displays the hypothetical cumulative $ +(-) achieved by holding a long position in US Dollar futures only during this period every year since 1971.
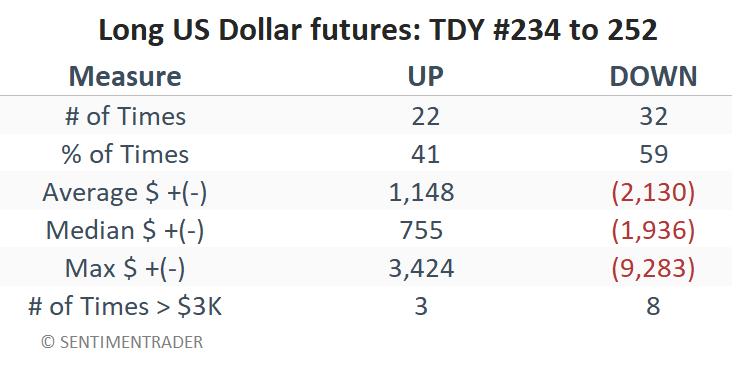
The table below summarizes the Dollar performance during this period, from 1971 to the present.
Unleaded Gas remains vulnerable to a downdraft
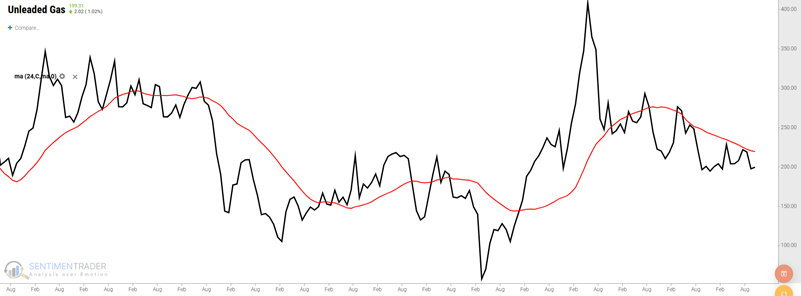
In the chart below, we see that Unleaded Gas has been in a downtrend but has spent the past several months trying to form a bottom. Could it bounce soon? Of course. Nevertheless, history suggests that short-term traders should continue to focus on the short side in the near term.
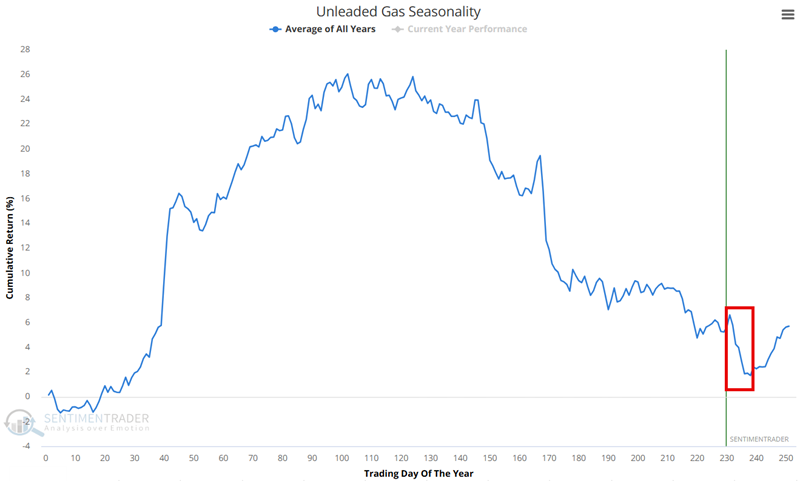
The Annual Seasonal Trend chart for the US Dollar highlights a period that extends from Trading Day of the Year (TDY) #231 through TDY #238. For 2025, this period extends from November 24th through December 3rd.
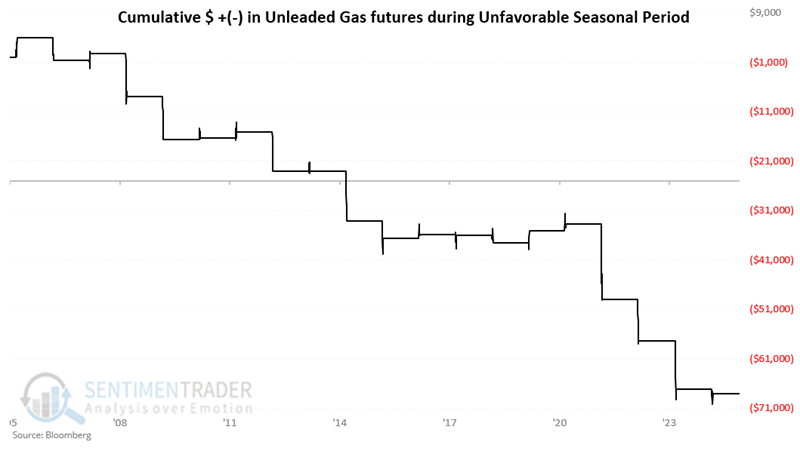
The chart below displays the hypothetical cumulative $ +(-) achieved by holding a long position in Unleaded Gas futures only during this period every year since 2005.
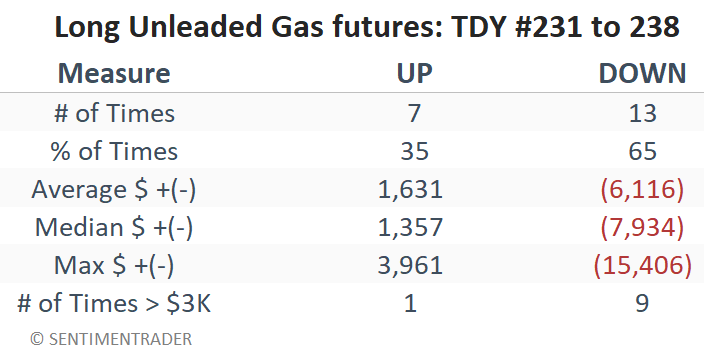
The table below summarizes Unleaded Gas performance during this period since 2005.
What the research tells us…
Each commodity market ultimately fluctuates based on its own supply and demand factors. Very often, these factors are influenced by seasonal fluctuations, and as a result, specific and unique opportunities can arise. Overall, commodity markets have been in an uptrend in recent years. The broad-based Bloomberg Commodity Spot Price Index is entering a period of typical short-term weakness. In conjunction with his potential general weakness, both the US Dollar and Unleaded Gas are vulnerable in the very short-term.
Aggressive traders who understand how to manage risk in the futures market might consider pressing their advantage in these market in the very near term.