
Short-term price action for the S&P 500 turns unfavorable

Key points:
- The MACD indicator triggered a risk-off sell signal for the S&P 500
- After similar MACD sell signals, the S&P 500 struggled up to six months later
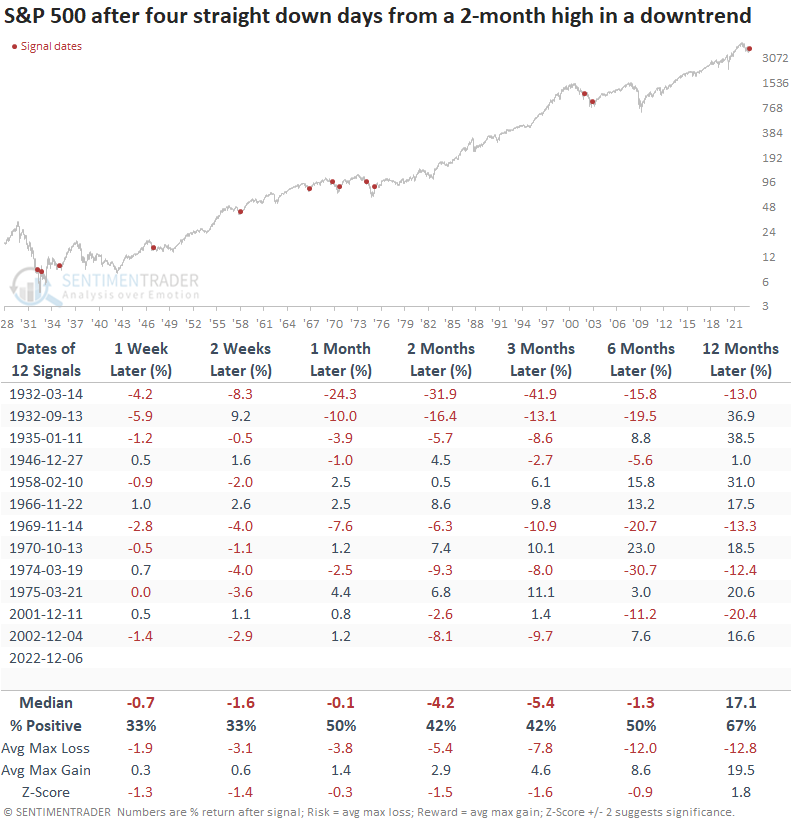
- The S&P 500 closed down four straight days from a 2-month high in a downtrend
- After similar price patterns, the S&P 500 struggled up to six months later
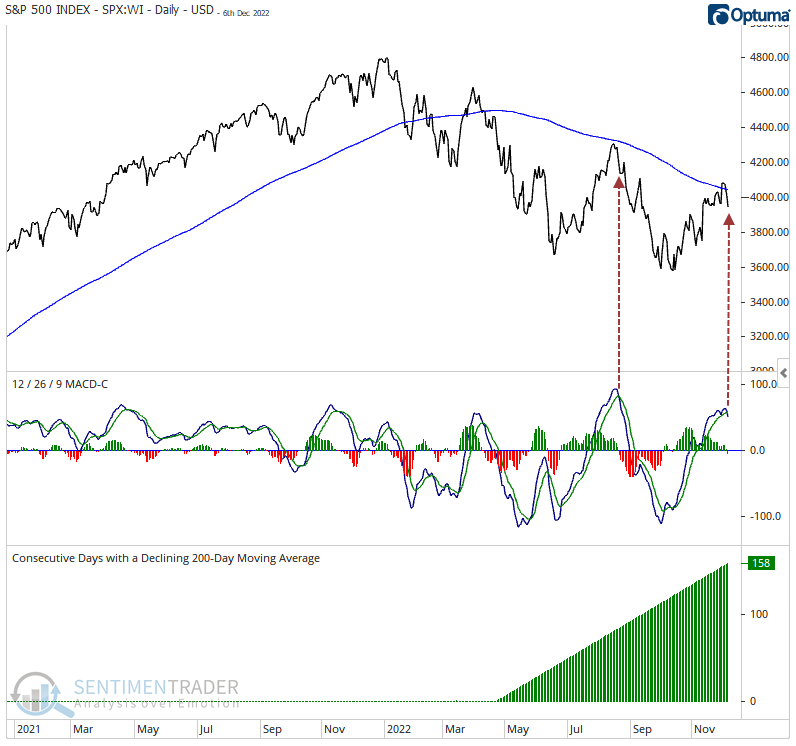
A popular technical indicator that measures price momentum signals risk-off
In a previous note, I shared how I use the popular technical indicator created by Gerald Appel, the MACD, to identify risk-off signals after a counter-trend rally in downtrends.
As a reminder, the system generates a signal under the following conditions. The differential between the MACD line and its nine-day exponential moving average turns negative, with the MACD line in positive or overbought territory. At the same time, the index trades below its 200-day moving average, and the average has been declining for at least 84 consecutive days.
On Tuesday, the MACD system triggered the second risk-off signal in 2022. The last alert was unkind to equities, with the S&P 500 declining 11% over the next two months.

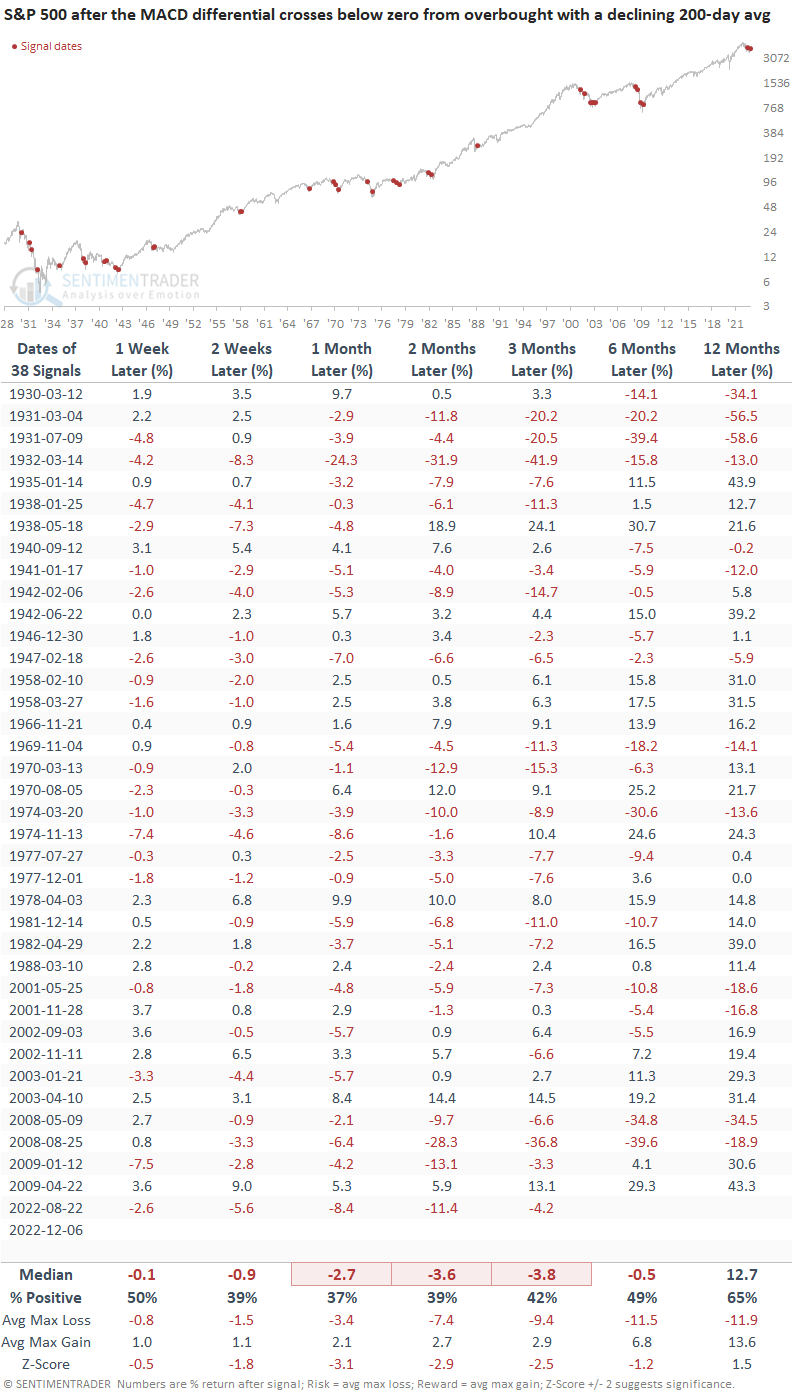
Similar MACD sell signals in a downtrend preceded negative returns
Large-cap stocks tend to struggle over the next six months when the S&P 500 is in a downtrend, and the MACD indicator signals a loss of price momentum in overbought territory. The signal shows a loss at some point in the first two months in 30 out of 38 instances.
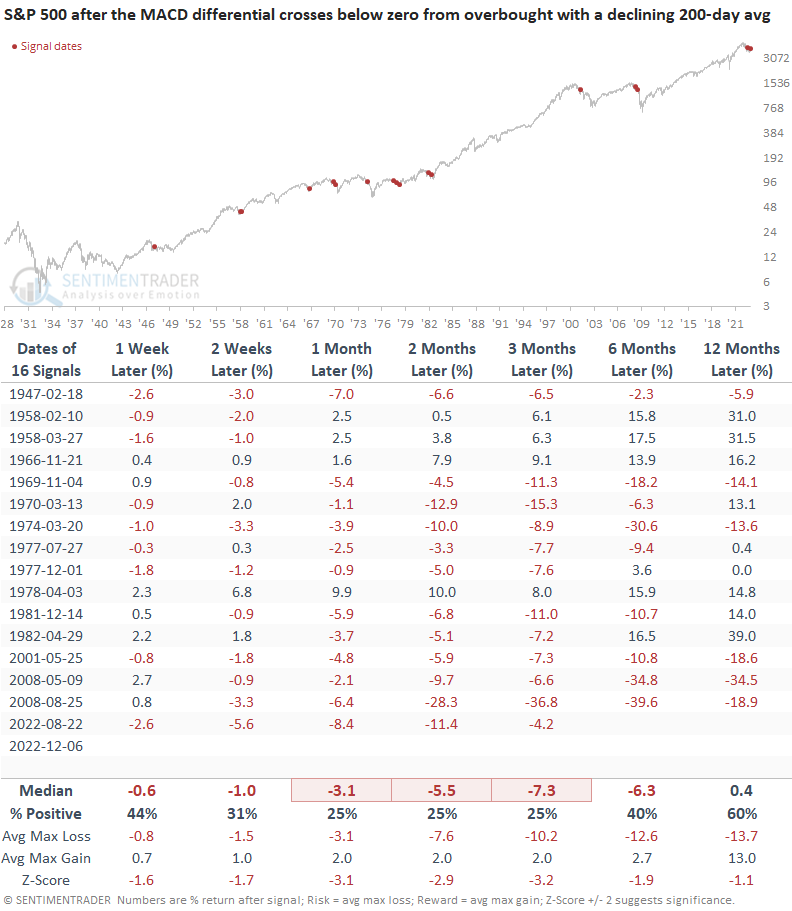
Like the August signal, the second alert occurred when the S&P 500 was down less than 20% from a multi-year high. MACD signals within 20% of a high tend to exhibit greater downside risk, especially in the first three months. The alert showed a negative return at some point over that time frame in 14 out of 16 instances.
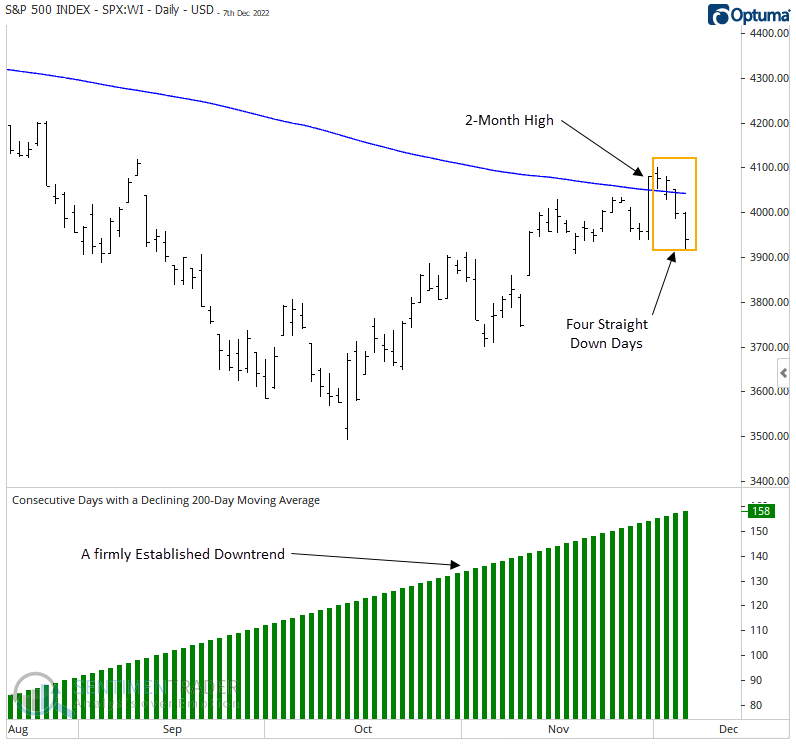
A bear market price pattern
On Tuesday, the S&P 500 Index registered its fourth consecutive down day. The successive down days occurred immediately after the Index closed at a 2-month high and within the context of a firmly entrenched downtrend.
Like the MACD signal, I will use a condition requiring the S&P 500 to have a declining 200-day moving average for at least 84 consecutive days to isolate signals similar to now.

Similar bear market price patterns preceded negative returns
Four consecutive down days from a 2-month high in a firmly established downtrend does not bode well for the S&P 500 over the next six months. The signal shows a loss at some point in the next month in 10 out of 12 cases. A few instances, like 1970 and 1975, occurred after the bear market low. In both cases, the Index consolidated over the next few weeks.
What the research tells us...
Similar to the June to August counter-trend rally, the S&P 500 responded to a deeply oversold condition in October, resulting in a rally accompanied by an impressive improvement in breadth-based indicators. While the thrusts and overall recovery in market breadth suggest better days ahead, the near-term could struggle as price action is starting to falter in a downtrend.