
Several sentiment gauges recover from a pessimistic phase, signaling a shift to risk-on

Key points:
- The S&P 500 Liquidity Premium indicator reversed lower after a phase of market uncertainty
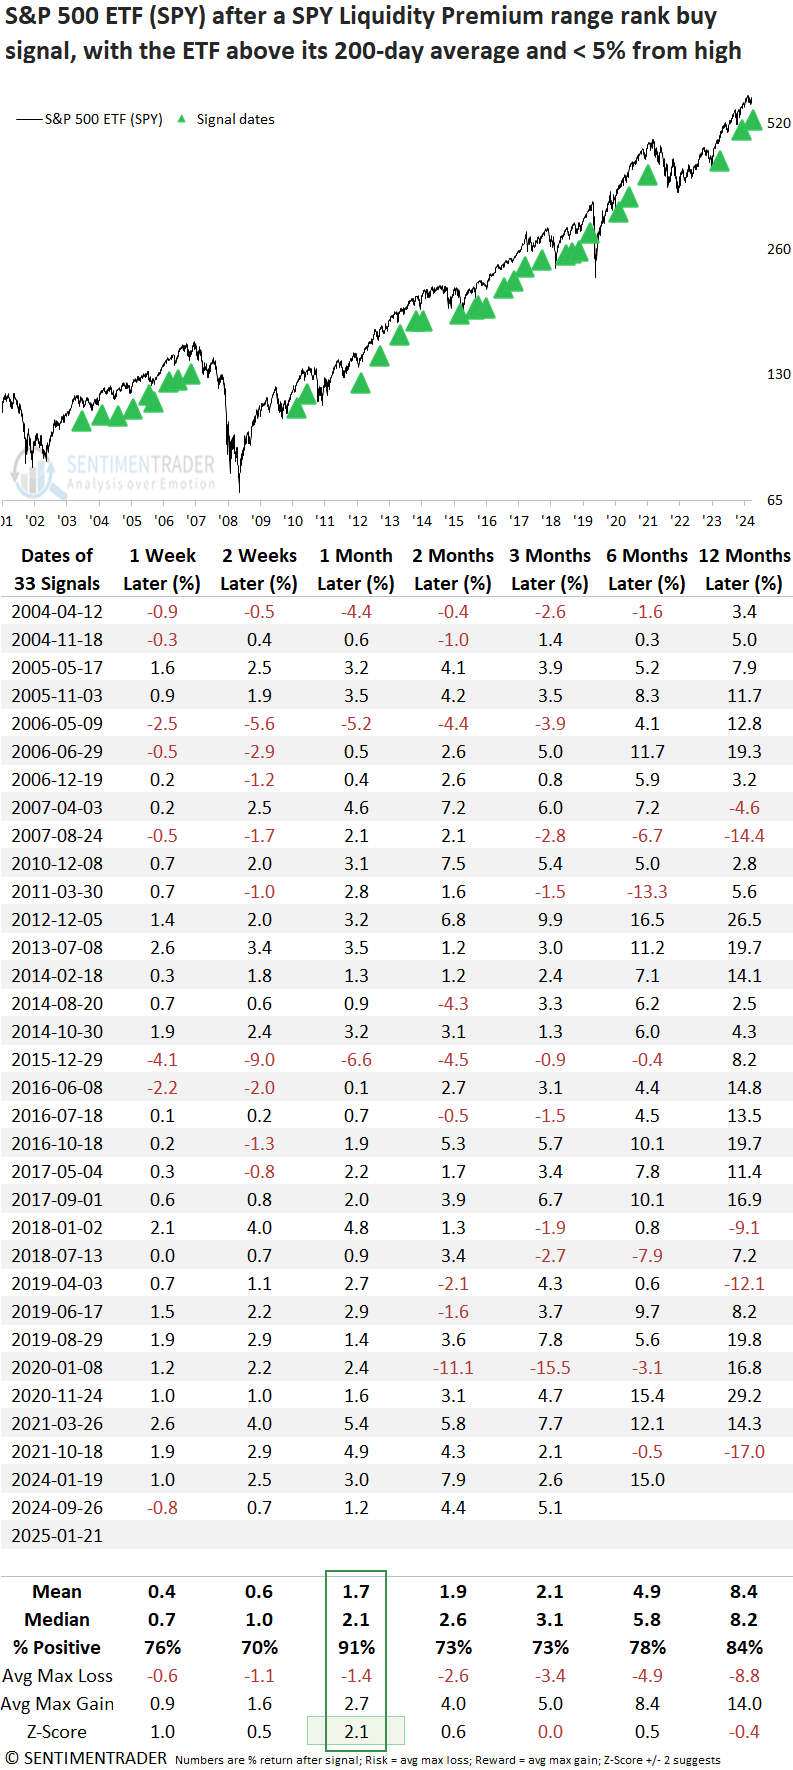
- Comparable shifts in this volume-based indicator produced a 91% win rate for the S&P 500 over one month
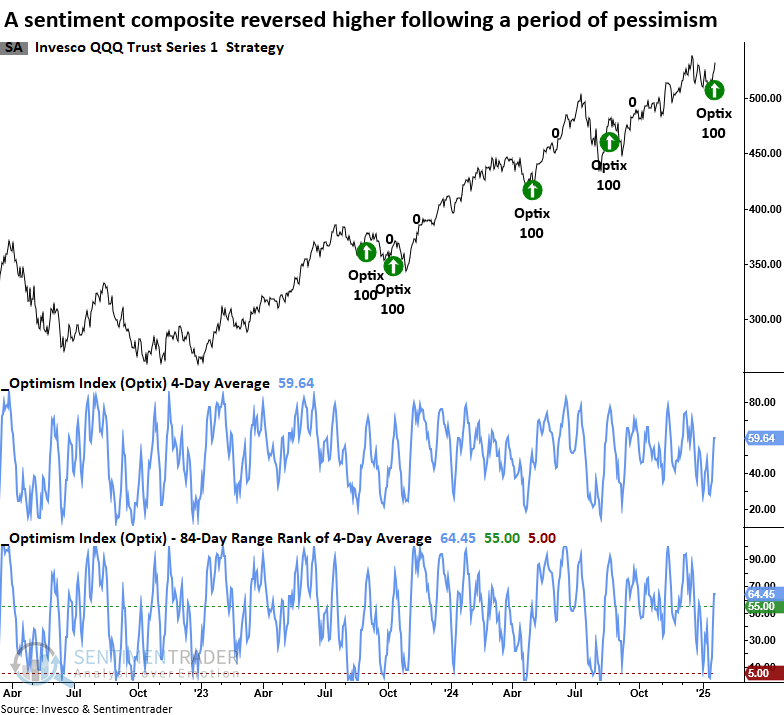
- The Optimism Index for the Nasdaq 100 ETF reversed higher after a period of pessimism
- Similar reversals in this sentiment composite produced an 89% win rate for the Nasdaq 100 over one month
Several sentiment indicators suggest a new bullish phase in stocks is underway
Recently, Jason and I published reports highlighting how sentiment-based indicators had reset to a more favorable position, effectively setting the stage for a shift away from market pessimism.
Now, we are observing confirmation of this sentiment reversal through systems monitoring the SPY Liquidity Premium and the QQQ Optimism Index, both of which have triggered bullish alerts. These signals point to renewed strength in the market, suggesting that another upswing in the ongoing bull market is underway.
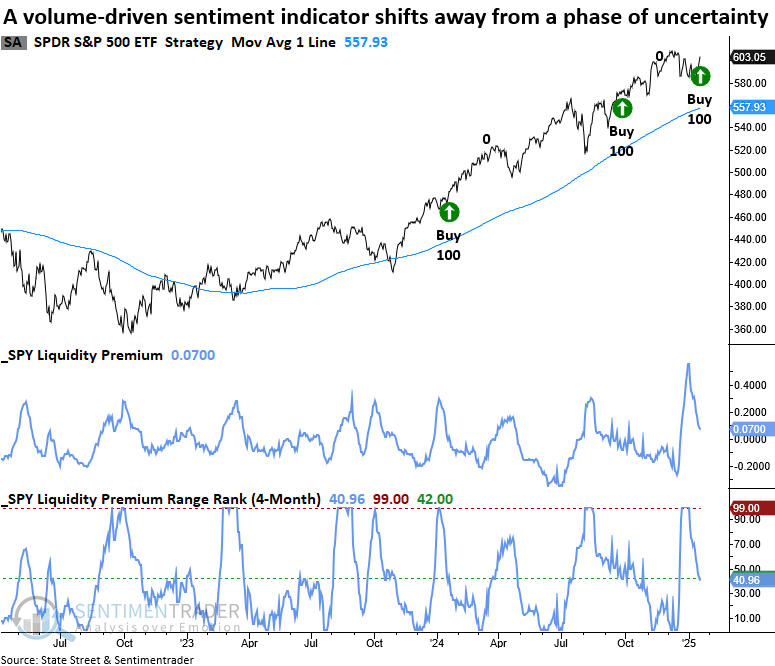
A trading model that utilizes the S&P 500 Liquidity Premium triggered a new risk-on signal, the first since September 2024. Following that alert, the S&P 500 gained 5.1% over three months.
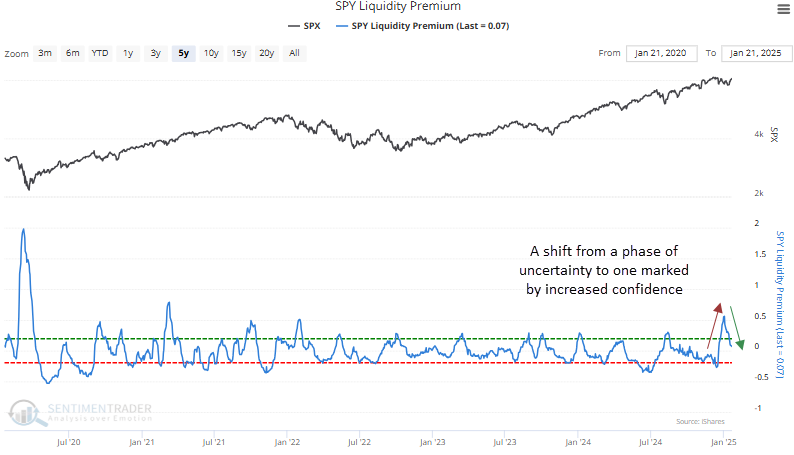
The system generates a buy signal whenever the 84-day range rank for the SPY Liquidity Premium indicator cycles from above 99% to under 42% and index momentum is positive. Additionally, I required the ETF to close above its 200-day average and trade with 5% of a 2-year high for context similar to now.
Similar volume-based sentiment shifts preceded a bullish outlook
Whenever the SPY Liquidity Premium's 84-day range rank cycled from above 99% to less than 42%, with the index above its 200-day average, less than 5% below a 2-year high, and exhibiting positive momentum, the S&P 500 ETF (SPY) displayed outstanding returns and consistency across all time frames.
The one-month horizon was particularly bullish, rising 91% of the time, exhibiting significance relative to random returns, and recording 16 consecutive gains.
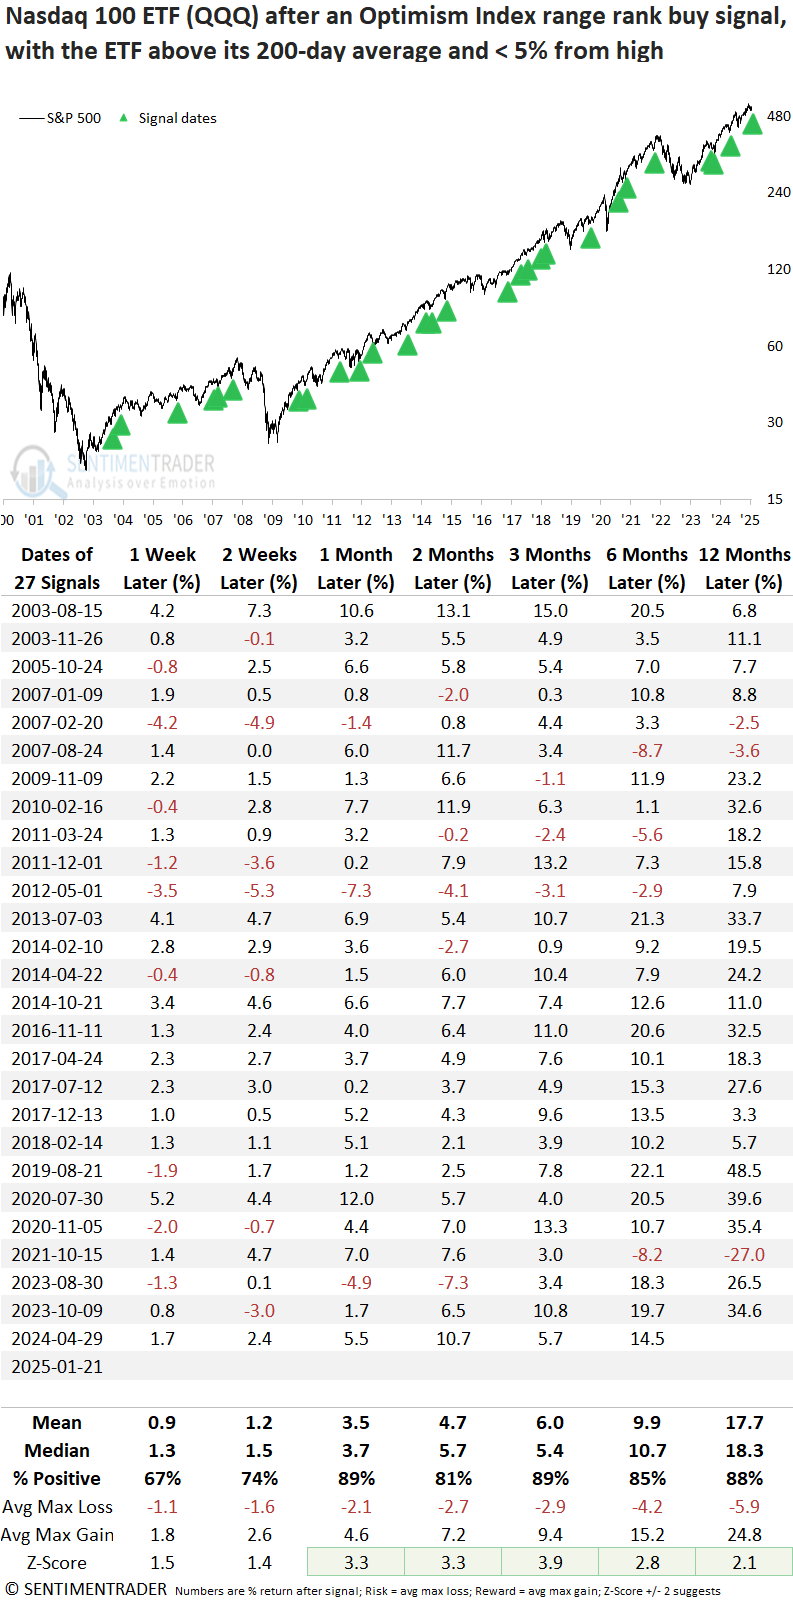
A favorable shift in sentiment for the Nasdaq 100
Following a stretch of negative sentiment, the Nasdaq 100's Optimism Index, which aggregates multiple sentiment metrics, reversed to the upside.
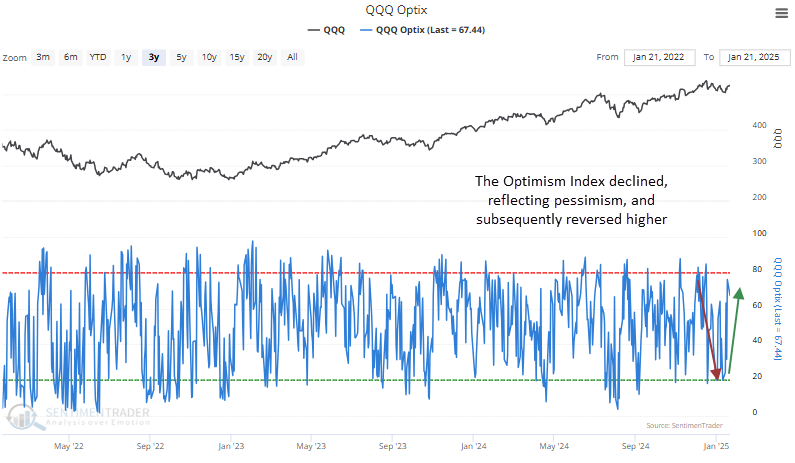
A buy signal is generated by the Optix system whenever the 84-day range rank of the Optimism Index's 4-day average moves from below 5% to above 55%, with positive index momentum. Additionally, I required the ETF to close above its 200-day average and trade with 5% of a 1-year high for context similar to now.
A sentiment shift in the Optimism Index for the Nasdaq 100, occurring within a long-term uptrend and near a recent high, delivered impressive returns and consistency for the technology-driven index over the subsequent year.
Over one- and three-month periods, the QQQ ETF advanced 89% of the time, with the three-month timeframe achieving an impressive streak of 16 consecutive gains. Furthermore, returns across the one- to twelve-month horizons exhibited statistically significant outperformance compared to random expectations.
What the research tells us...
Several sentiment indicators recently reversed course after a period of pessimism, triggering buy signals for trading systems designed to monitor shifts in investor behavior. Historically, such sentiment reversals have marked the beginning of strong near-term rallies, as traders often scramble to reposition during the early stages of a recovery. These systems, particularly effective in identifying inflection points, have produced outstanding returns and consistency under similar precedents.