
Several market breadth indicators with a flawless track record just triggered a buy signal

Key points:
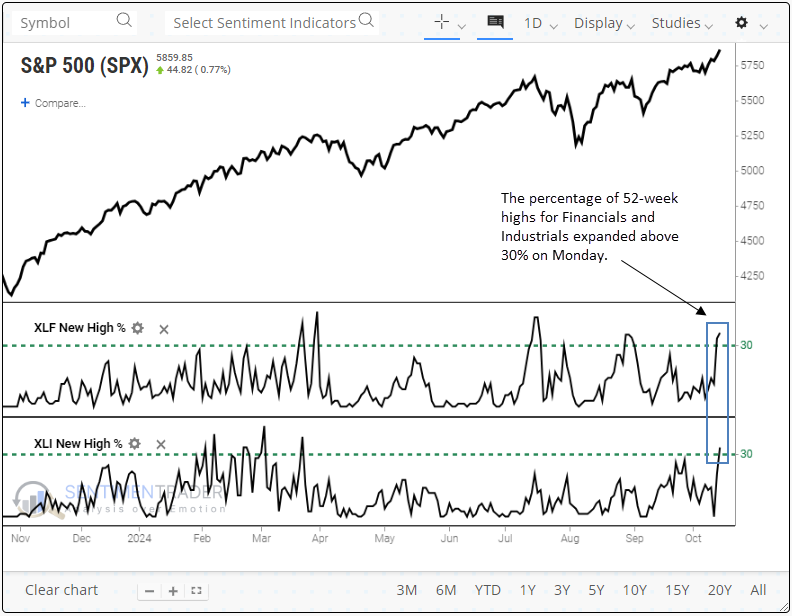
- Over 30% of S&P 500 Financial and Industrial sector stocks registered a 52-week high on Monday
- Comparable expansions in highs saw the S&P 500 rise 100% of the time over the subsequent year
- Over 90% of S&P 500 Financials closed within 5% of a 252-day high, triggering a flawless signal
An expansion in 52-week highs provides additional fuel for the bulls
In a report on Monday, I highlighted a bullish combination of 52-week highs from Discretionary, Financial, and Industrial sector stocks, signaling an expansion in participation typically associated with sustainable uptrends.
Following another record close for the S&P 500 in yesterday's session, 52-week highs for Financial and Industrial stocks expanded to an even more bullish level.
For only the 21st time since 1954, 52-week highs for members of these sectors surpassed 30% simultaneously. The previous signal occurred in March of this year, and the S&P 500 gained 8% over the following six months.
Similar expansions in new highs preceded a bullish bias for the S&P 500
When over 30% of stocks in the S&P 500 Financial and Industrial sectors achieved a 52-week high simultaneously, the S&P 500 posted gains in the subsequent year every time. Additionally, medium-term performance was positive, with the index advancing at some point in the ensuing three months in all cases.
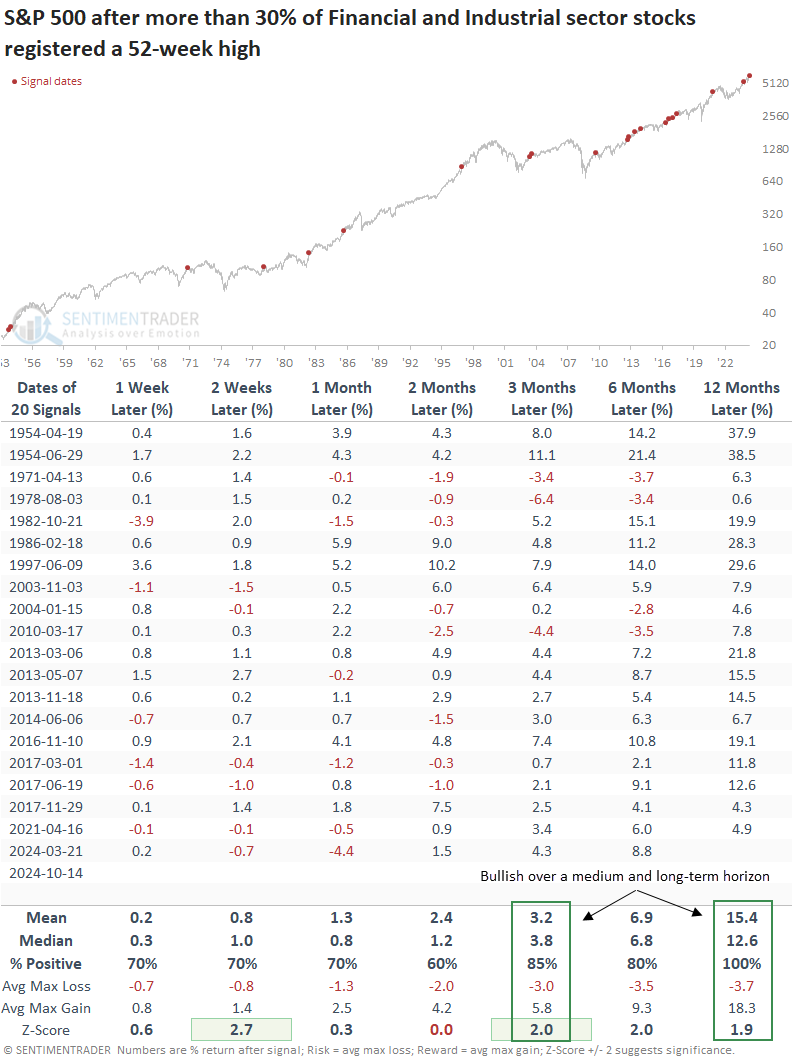
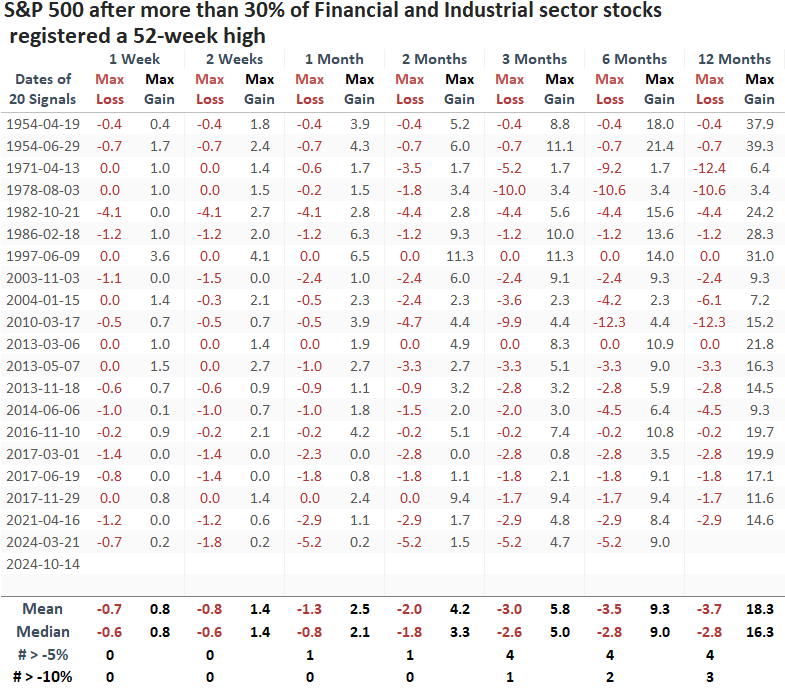
Over the subsequent year, the S&P 500 experienced just four instances of a maximum loss exceeding 5% and three precedents of greater than 10%. Furthermore, no signal surpassed a drawdown exceeding 12.4%, indicating that an expansion in highs like now typically occurs well before a significant stock downtrend.
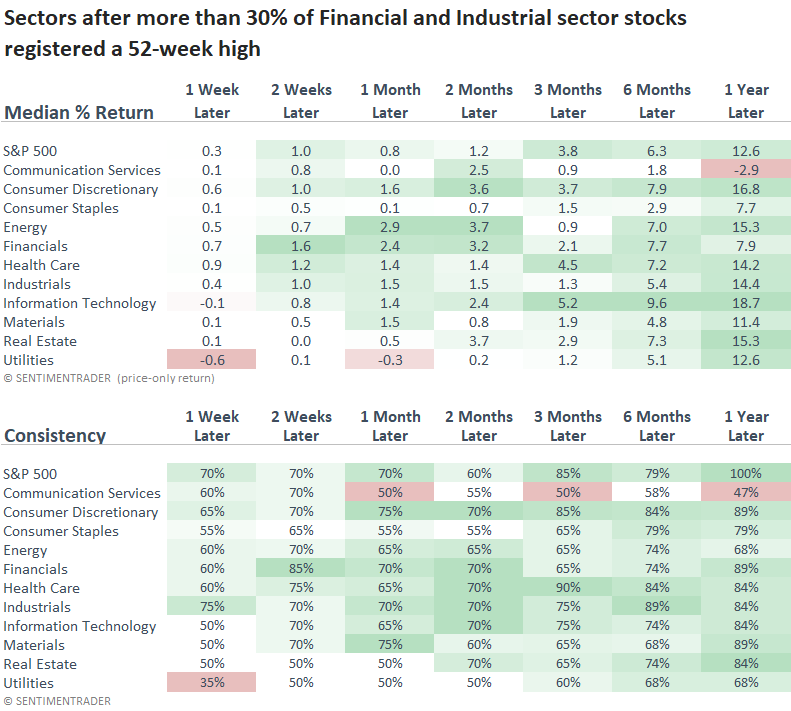
Although Financials and Industrials advanced over the next year, their performance relative to the S&P 500 was mixed. Financials outperformed early, particularly in the first two months, but lagged by the one-year mark. Industrials, on the other hand, struggled over short-to-medium-term periods but eventually outperformed after a year.
The most consistent outperformance came from the Consumer Discretionary and Technology sectors.
52-week highs in the Financial sector could surge even higher
With over 90% of S&P 500 Financial sector stocks trading within 5% of a 252-day high, a reading seen in only 1% of trading sessions since 1954, one cannot rule out even more new highs from this systemically important group.
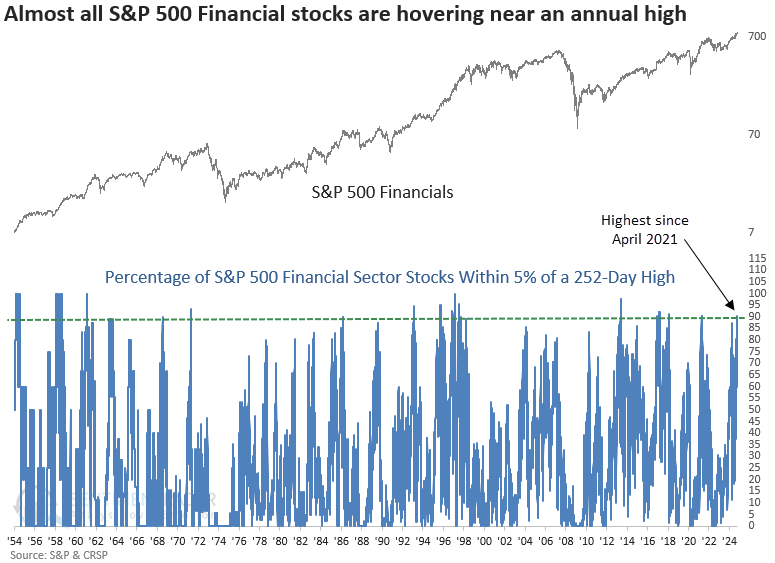
While rare, whenever the percentage of S&P 500 Financial sector stocks trading within 5% of a 252-day high cycled from less than 20% to more than 90%, the systemically important sector displayed outstanding returns and consistency, rising 100% of the time over the following year.
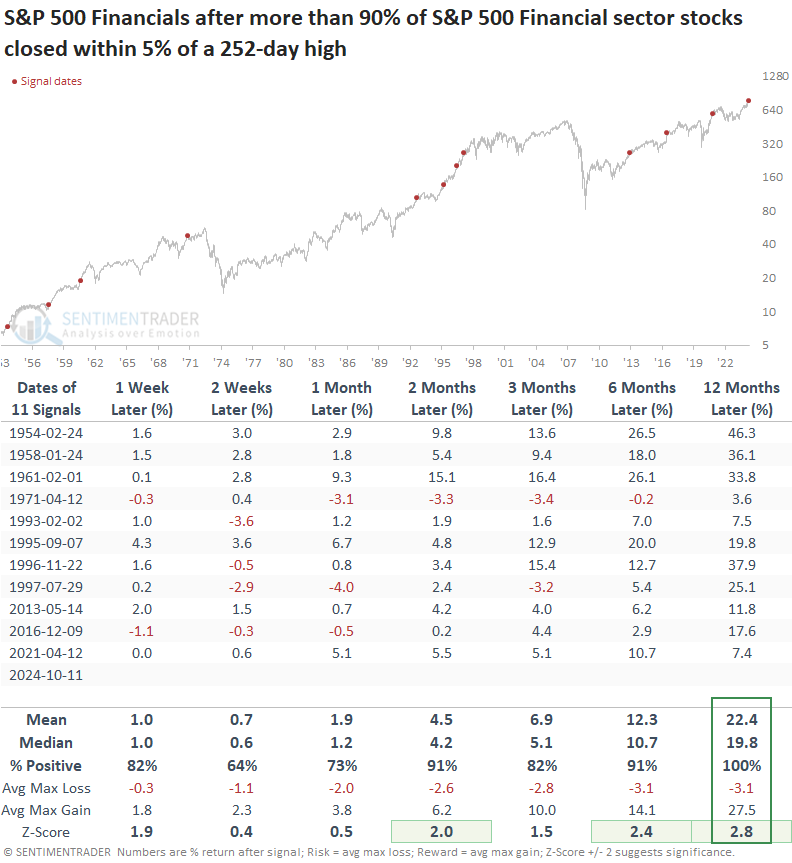
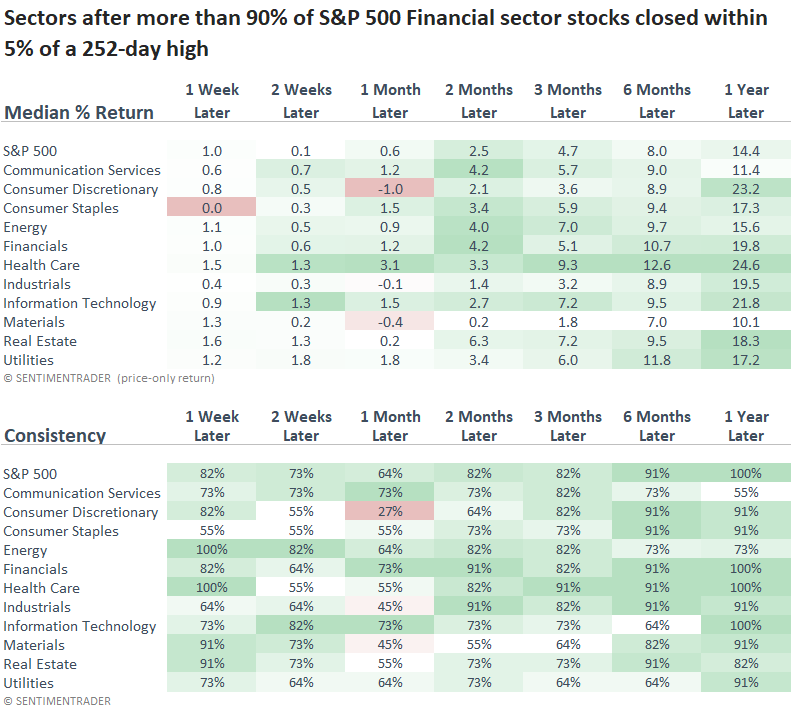
Healthy participation from stocks in the Financial sector often bodes well for the broader market, as the S&P 500 and sectors delivered robust returns and consistency over medium and long-term horizons. Furthermore, the S&P 500, Health Care, and Technology matched the win rate from the Financials, rising every time a year later.
What the research tells us...
The team at Sentimentrader excels at providing objective, data-driven insights that help traders and investors gauge the sustainability of market trends. Recently, the evidence has tilted heavily in favor of the bulls, with multiple studies indicating that the current rally is likely to persist. On Monday, the bullish case strengthened, with 52-week highs for stocks in the Financial and Industrial sectors surging above 30%. Similar expansions in new highs saw the S&P 500 rally 100% of the time over the subsequent year. Additionally, over 90% of S&P 500 Financial sector stocks closed within 5% of a 252-day high, a scenario that has resulted in a gain every time a year later for the sector and the broad market.