
Several indicators cast doubt on oversold crude oil

Key points
- Crude oil has traded in an overall downtrend since mid-2022
- While slightly oversold, a variety of factors argue against jumping in on the long side
- Component Correlation, term structure, and seasonality all weigh on the unfavorable side
Oil might be oversold, but...
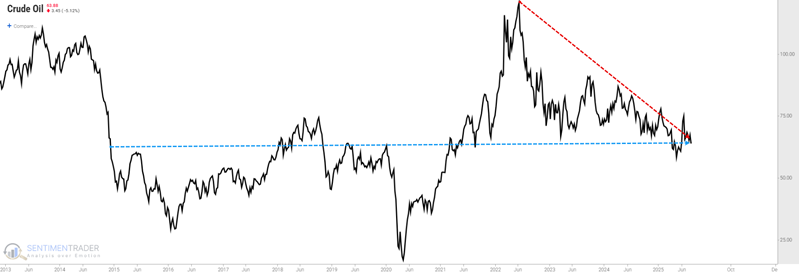
The price of crude oil has traded sideways for almost a decade.
However, that disguises the fact that crude has slid nearly 45% in the last three years. According to some short-term technical measures, crude is oversold and may be due for a bounce.
There are some reasons to distrust those measures at the moment.
In this note dated July 8th, I highlighted some negative factors for crude oil and unleaded gas. Now the action of the energy sector in stocks is flashing a potential warning sign.
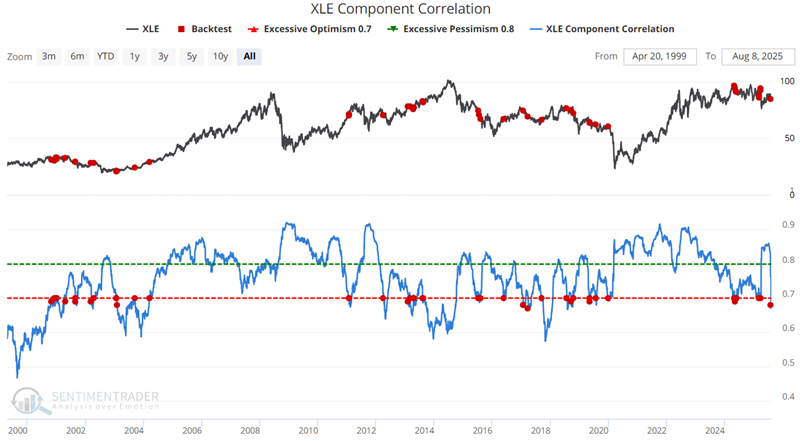
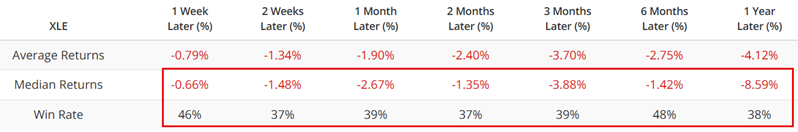
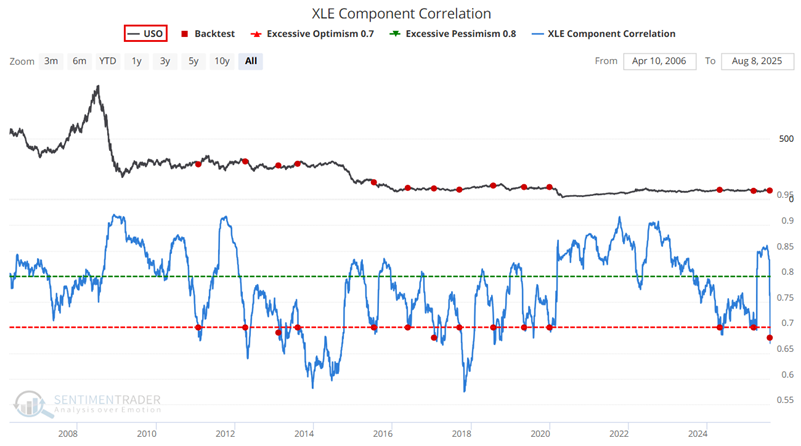
The XLE Component Correlation shows the degree to which the stocks in the S&P 500 energy sector are trading alike. High readings tend to highlight pessimism and are generally favorable. However, when the indicator crosses below 0.70, it suggests complacency. The results indicate negative median returns for all timeframes within one year of the signal, and a win rate well below 50%.
Influence on energy products
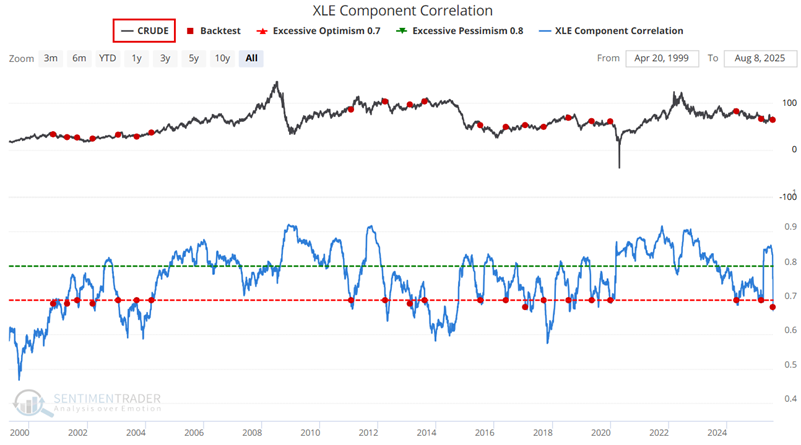
Now let's turn our attention to crude oil futures and ETFs.
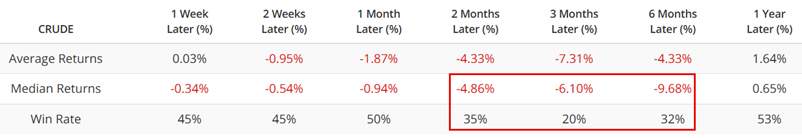
The chart and table below display crude oil futures performance after the XLE Component Correlation indicator crossed below 0.70 for the first time in three months. Crude oil futures were higher only 20% of the time three months later, and median losses were significant two to six months after a signal.
Below are the results for the United States Oil Fund ETF (USO) following signals since 2006.
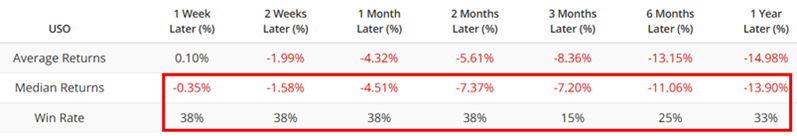
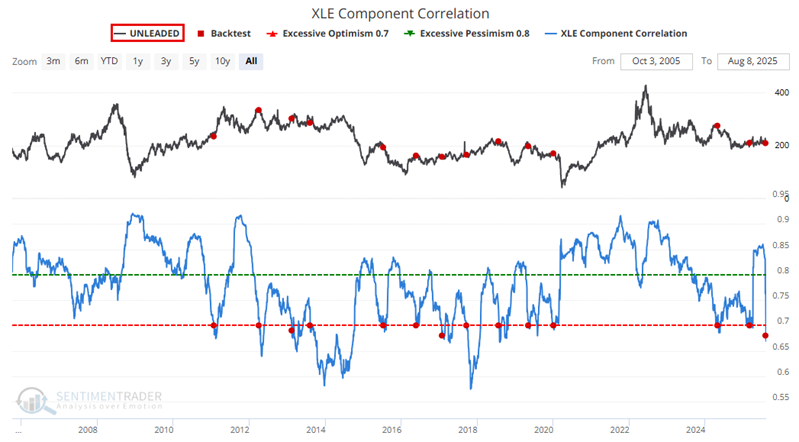
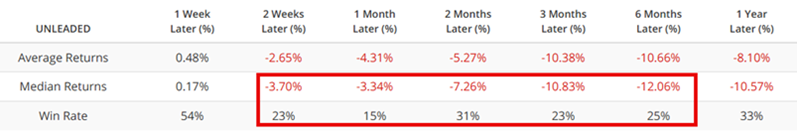
Historical results for unleaded gas futures are similarly dismal. Looking again at XLE Component Correlation drops below 0.70, we see results heavily skewed to the negative side, with only a 15% win rate over the following month.
Term structure and seasonality remain problematic
The term structure of crude oil futures shows the relationship of the near-term futures contract to a further-out contract. If it is above 1, the near-term contract is priced higher than the further-out contract, called backwardation.
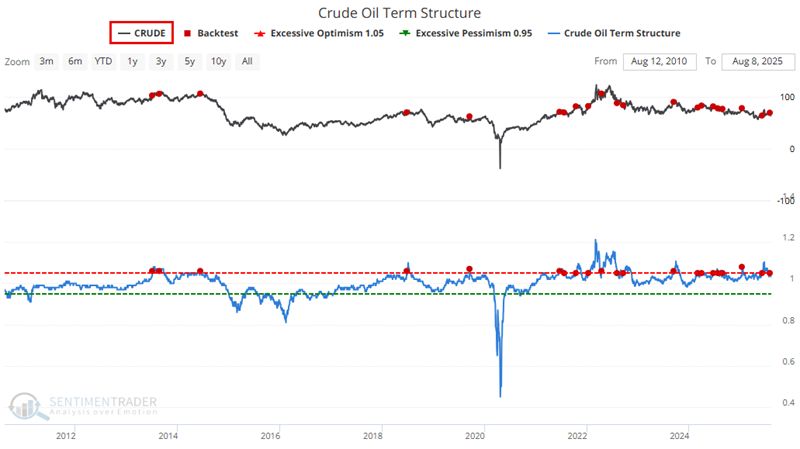
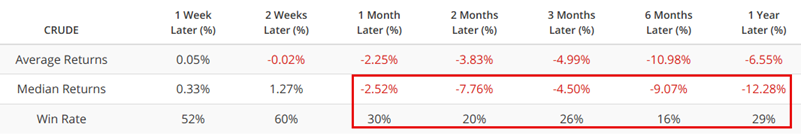
On June 6th, and again on July 30th, crude oil term structure crossed above the significant level of 1.05 for the first time in 21 days. Below, we summarize the results for oil. The contract was higher only 16% of the time six months later.
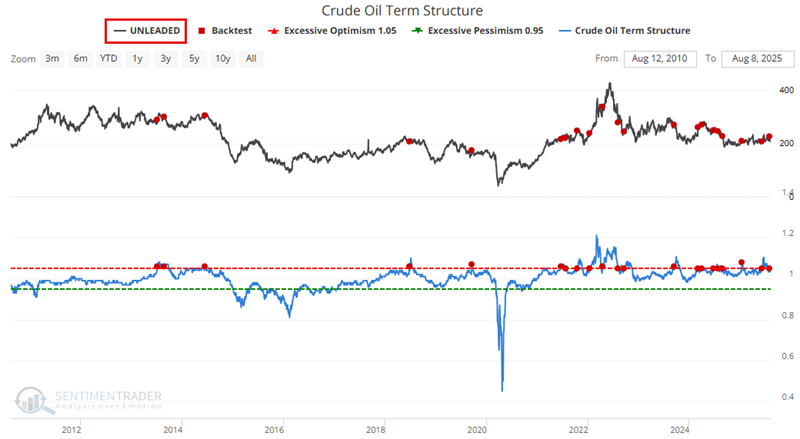
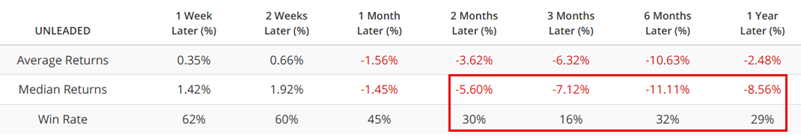
Here are the results for unleaded gas. Again, the contract struggled in the months ahead, rallying only 16% of the time over the following three months.
Unfavorable seasonality still hangs over the energy markets. The USO seasonality chart highlights two periods with a strong tendency to show weakness.
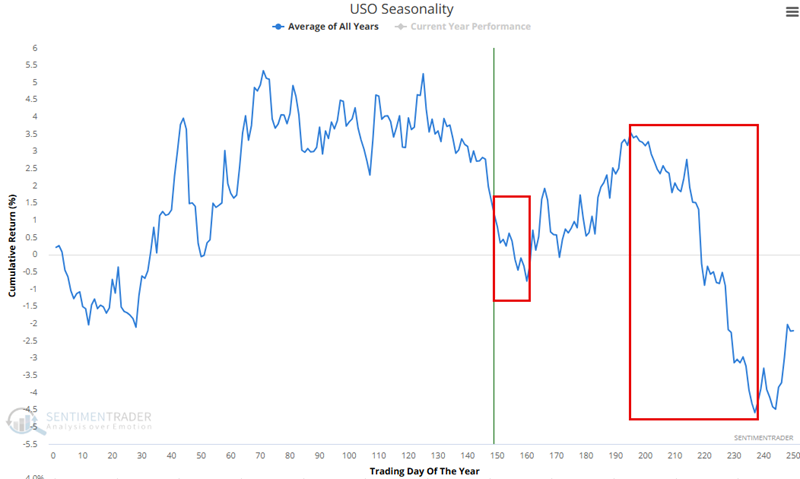
The first extends from Trading Day of Year (TDY) #150 through #160.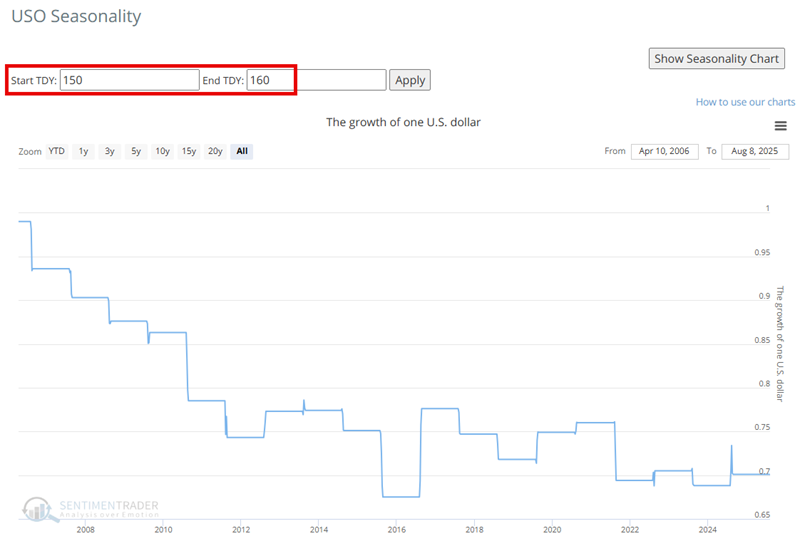
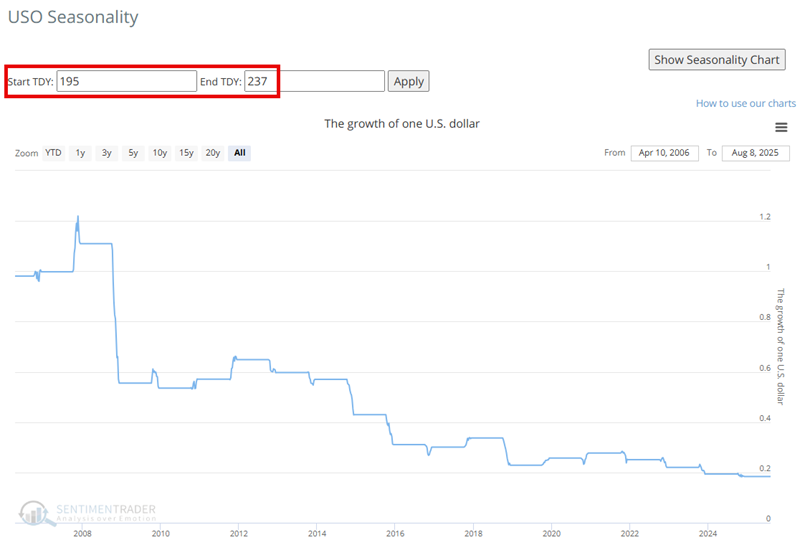
The second extends from TDY #195 through TDY #237.
These periods rarely see crude oil exhibit significant strength.
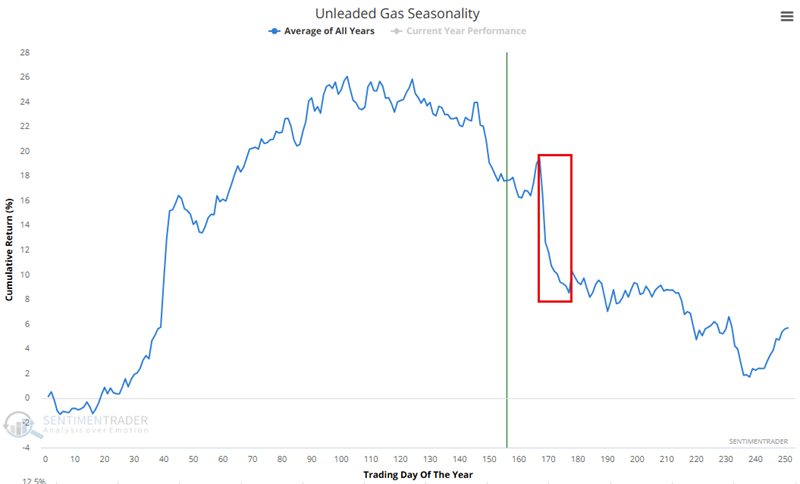
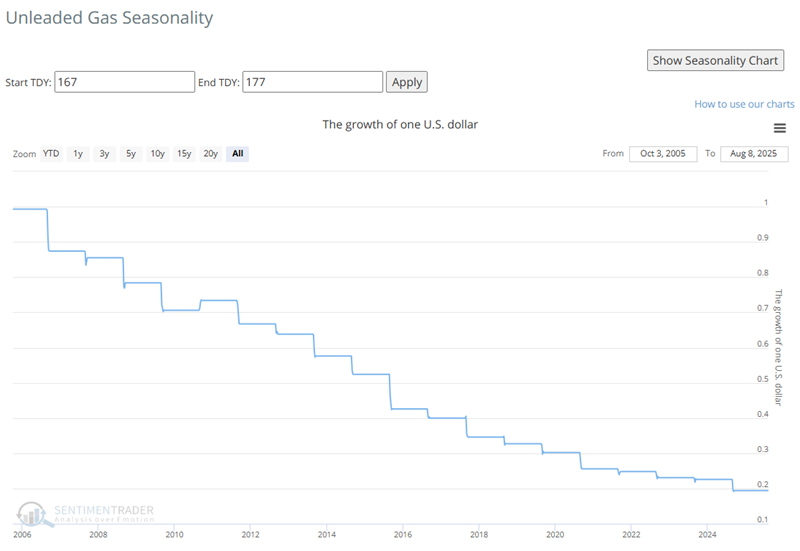
The unleaded gas seasonal chart shows weakness from Trading Day of Year (TDY) #167 through #177. For 2025, these dates run from the close on August 26th through September 9th. Beyond that, unleaded shows a strong tendency for weakness through the year's second half.
The hypothetical growth of $1 in unleaded gas during this brief period has been an unrelenting decline, losing over 80% since 2006.
What the research tells us...
Trading is a game of probabilities. Despite the evidence presented here, the possibility of oil and gas rallying remains. Speculators need to weigh that probability, perhaps with the support of oversold technical indicators, versus the historical record of poor returns following low correlations among energy stocks, crude contracts in backwardation, and generally poor seasonality. Based on the above, the headwinds are strong for crude in the coming weeks and months.