
Several breadth thrusts are likely to sustain the positive momentum

Key points:
- The S&P 500 Financials triggered a breadth thrust signal while simultaneously closing at a high
- Similar thrusts produced solid returns and consistency for Financials over the following year
- The Nasdaq 100 generated a breadth thrust alert, with the index above its 200-day average
- Comparable thrusts preceded an 88% win rate for the Nasdaq 100 over the subsequent year
Breadth thrust signals suggest the upside momentum persists
With most indexes and sectors exhibiting relentless upside price momentum since bottoming on August 5th, it shouldn't be surprising to see breadth thrusts starting to trigger, especially ones that utilize ten days or fewer in the calculation. One such measure is the 10-day A/D ratio, an indicator that we recently added to the spotlight on breadth page on the website.
Over the past ten days, no sector has seen a more pronounced skew toward advancing issues than financials, as highlighted in the table below. The sector's 10-day A/D ratio stands at 3.23, the third highest since our website data began in 1998. When reviewed against a broader dataset extending back to 1952, it ranks the 11th highest.
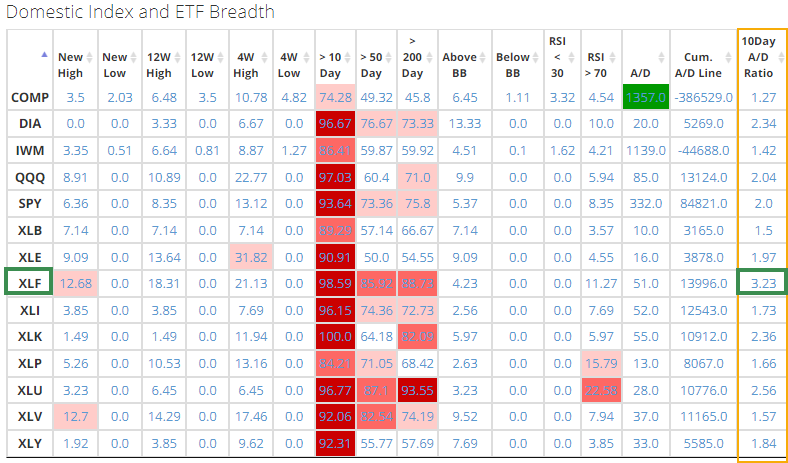
The 10-day A/D ratio is calculated by summing the advancing and declining issues over ten days and then measuring the ratio between the two totals. This breadth thrust is often called breakaway momentum, a concept popularized by the respected market analyst Walter Deemer.
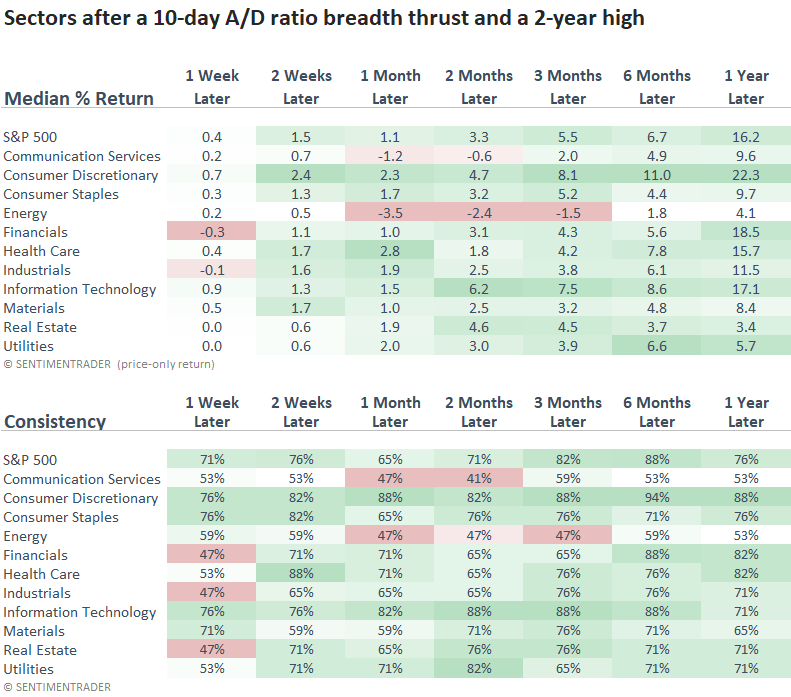
Similar thrusts accompanied by a 2-year high preceded positive returns
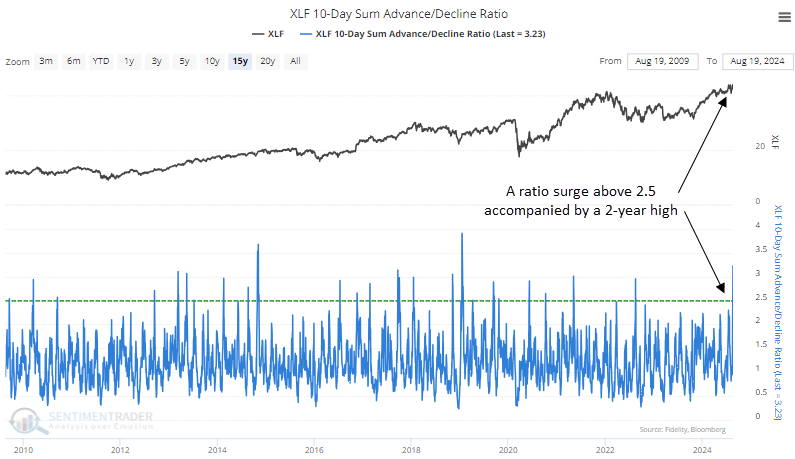
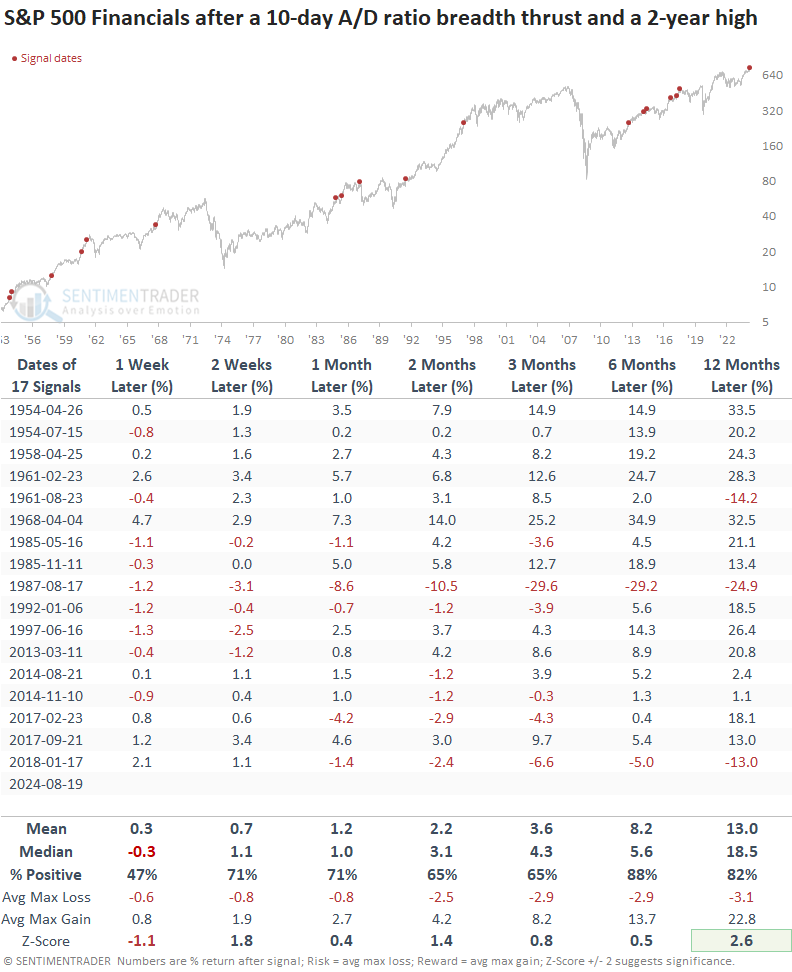
Whenever the 10-day A/D ratio for the S&P 500 Financials increased above 2.5 as the index simultaneously closed at a 2-year high, the positive momentum in the sector tended to persist from two weeks to twelve months later. However, as is typically the case following a thrust, don't be surprised if financials suffer over the next week to digest the gains.
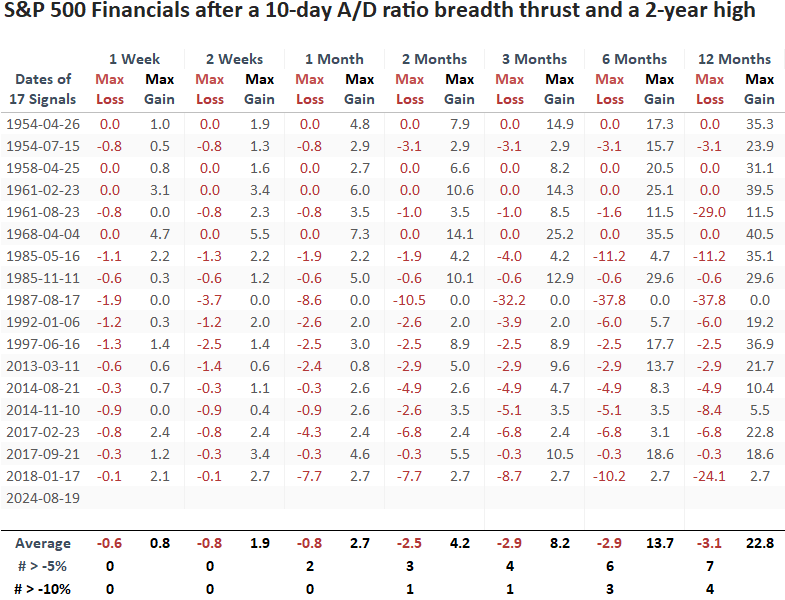
Maximum losses beyond -5% or -10% over the following three months were rare, with only four and one precedents, respectively. The 1987 and 2018 instances highlight the critical role of effective risk management in trading and investing. A market that deviates from expected behavior is often a red flag.
Financials were the worst-performing sector over the first week as it consolidated the gains after the thrust. While it trailed the S&P 500 from two weeks to six months later, it outperformed a year later and exceeded most sectors over that horizon. Unsurprisingly, cyclical-oriented sectors outpaced defensive groups.
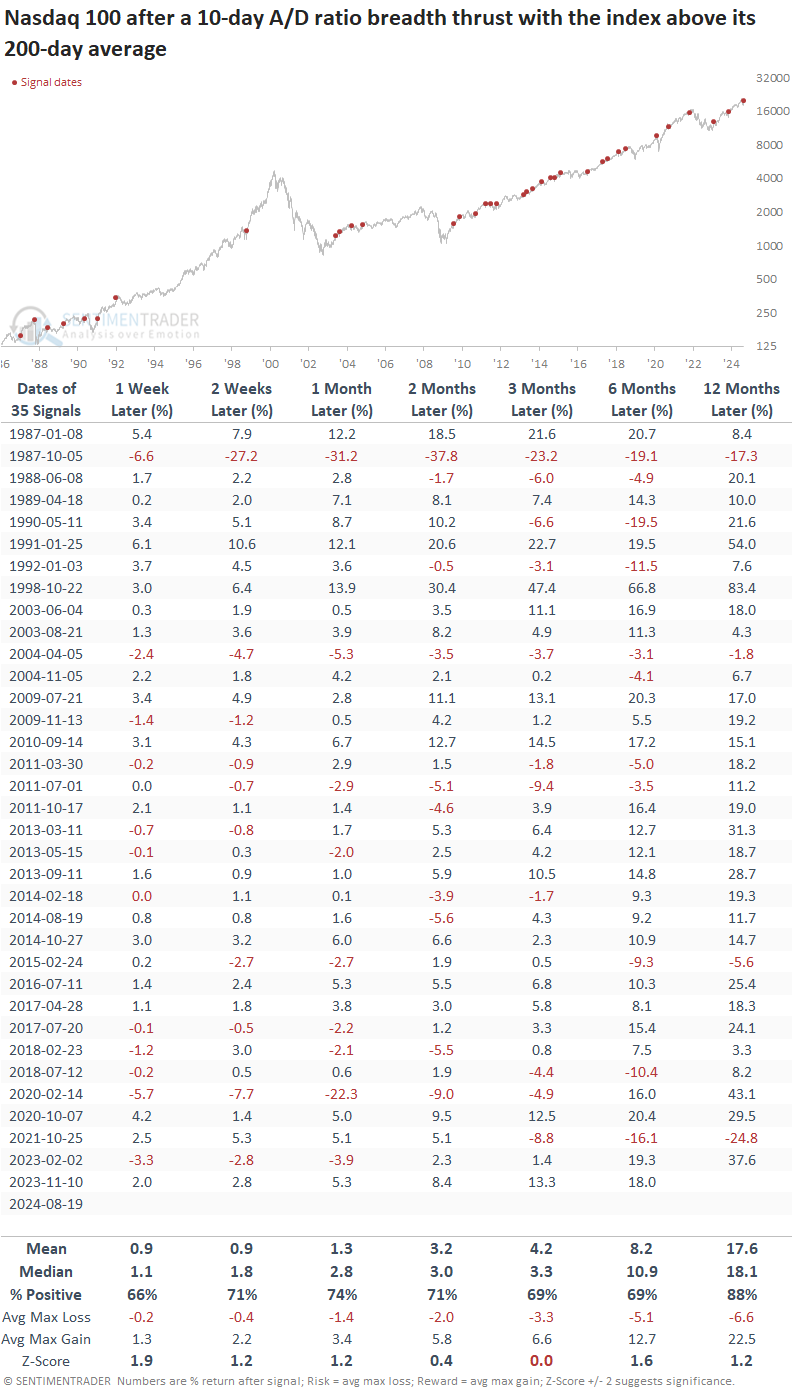
A Technology-oriented index triggered a thrust
The Nasdaq 100, a popular benchmark followed by investors, saw its 10-day A/D ratio increase above 2.0, with the index above its 200-day average. Following similar thrusts, the Nasdaq 100 displayed solid returns and consistency, especially a year later, rising 88% of the time.
What the research tells us...
Breadth thrust signals for the S&P 500 Financials and the Nasdaq 100 were activated when their 10-day A/D ratios surged past significant threshold levels as the indexes displayed trend conditions commonly linked to long-term uptrends. After experiencing similar thrusts, both indexes demonstrated a steady upward trend over the following year, advancing 82% and 88% of the time, respectively. Most indexes have experienced significant advances over the last few weeks, so don't be surprised if some backing and filling occurs. As always, trust the thrust.