
Sentiment so bad it may be getting good

Key Points
- The University of Michigan Consumer Confidence Survey has plunged in recent months
- This news is generally reported as bad news in ominous tones, with the implication that bad times are ahead
- However, as with most things sentiment-related, most people get it exactly backward
First the caveats
Before getting to the "meat" of this article, let's get the caveats out there. First off, what follows is NOT a trading system, a standalone buy/sell signal generator, a "sure thing," or even an "All Clear" signal. In fact, the number of previous occurrences is low enough that I also have to issue the standard caveats warning about relying on a small sample size.
The heart of the matter
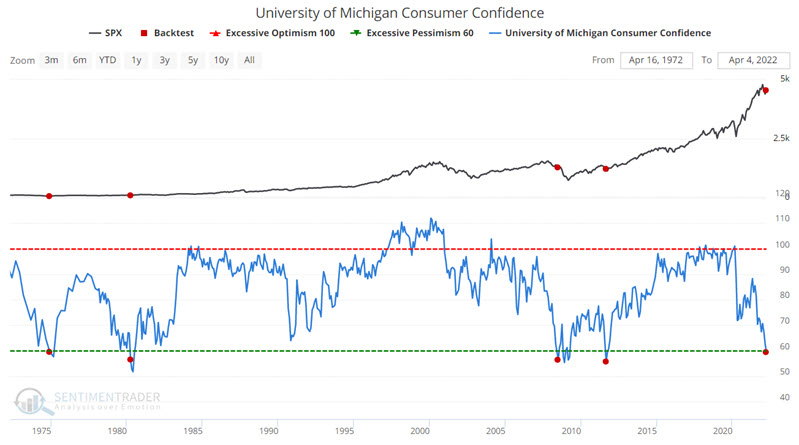
The University of Michigan Consumer Confidence index is designed to measure the current level of consumer confidence in the U.S. economy. You can read the details here. Like may sentiment indicators, it tends to be contrarian in nature when it reaches an extreme level - i.e., high readings tend to occur not long before a top in the stock market, and economy and low readings tend to occur not long before a bottom in the stock market and economy.
The Index value for March 2022 fell to 59.4%. I consider 60% to be an important "extreme" level. The chart below displays all months since 1953 when the survey showed a value below 60.
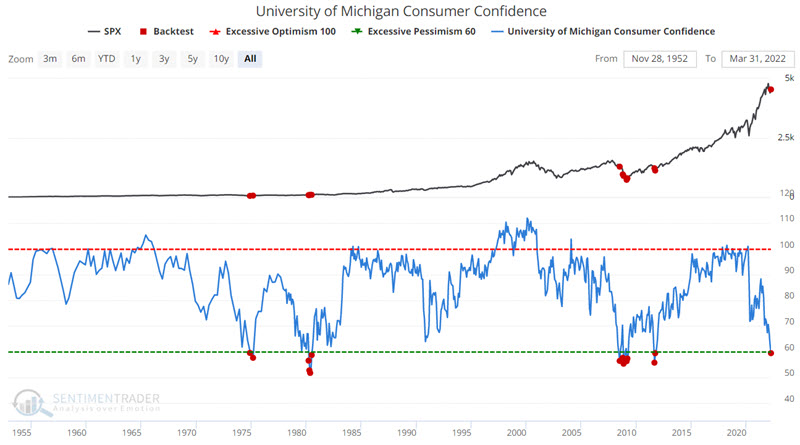
As you can see in the chart above, this is an infrequent occurrence, with only four previous "clusters" of signals. It should be noted once again that four occurrences in almost 70 years constitute a very small sample size. But for argument's sake, let's consider stock market performance following previous instances of sub-60% readings.
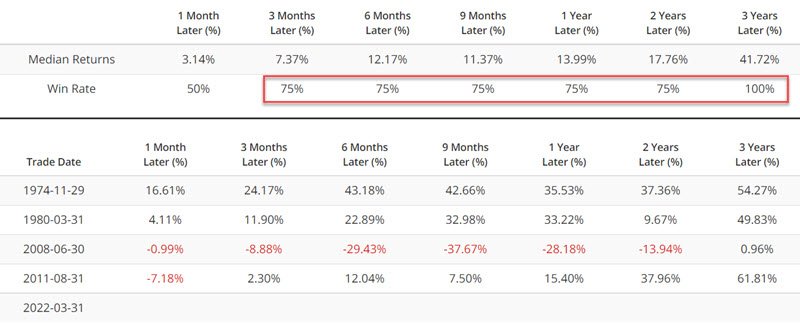
The table below displays a summary performance following all previous sub-60 readings, including overlaps.
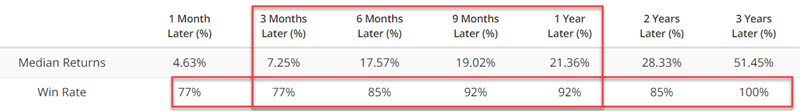
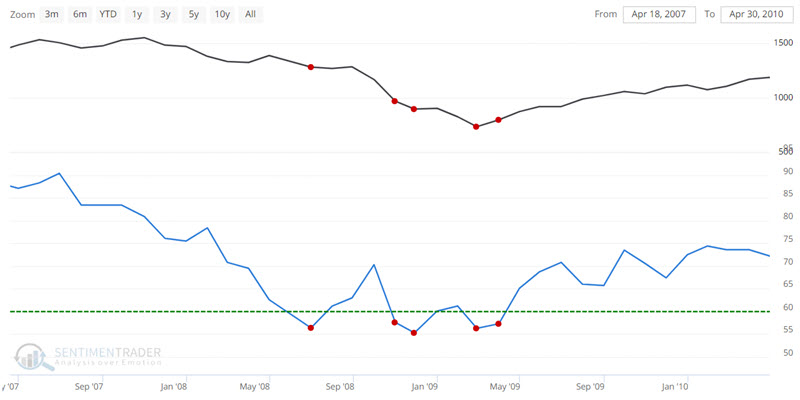
The Median Return and Win Rate figures are excellent on the whole. But as I said earlier, a drop below 60 is NOT an "All Clear" signal. Let's focus specifically on 2008. The chart below shows that the U of M Index bounced around below 60 for several months. All the while, the stock market plunged.
The relevant information is highlighted in the table below.
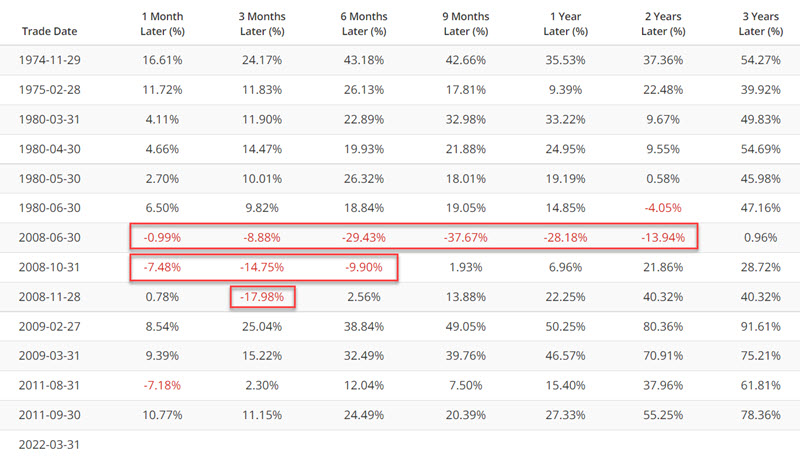
The bottom line is that this survey is only one factor that may impact the market. If enough other factors remain on the negative side of the ledger, there is no reason that market cannot continue to fall. Hence the reason this particular indicator should not be relied upon as a standalone model.
At present
The U of M Index closed at 59.4% at the end of March 2022, thus signaling that sentiment has gotten so bad that - historically speaking - we might anticipate higher stock prices in the years ahead. However, the 2008 experience reminds us that the "good news" (i.e., a sustained stock market rally) will only occur after the "bad news" has played out (i.e., after whatever decline the market presently has in store for us has run its course).
If we look solely at results following the first drop below 60% in 12 months, we get the results found in the chart and table below.
Once again, a minimal sample size, mostly very favorable results, and one huge exception (2008).
What the research tells us…
The proper way to use the information above is two-fold. First, as part of a "weight of the evidence" approach, the latest signal now places this indicator on the bullish side of the ledger. But it is only one piece of the puzzle. Second, investors may be wise to use this information to help tune out some of the "doom and gloom" that fills the financial news these days. While we cannot use this indicator to forecast a market bottom with "uncanny accuracy," we can use it to remind us that the "fear and loathing" may be getting a bit overdone.