
Sentiment is turning after a long stretch of excess

Key points:
- The spread between Smart and Dumb Money Confidence is reversing from an extreme level
- Similar behavior preceded a resumption of the bear market over the past two years
- But persistent optimism doesn't happen during bear markets, suggesting this is a new environment
Sentiment is starting to reverse from extreme optimism
Bull markets need investors to become increasingly bullish to sustain themselves. If investors aren't feeling optimistic, they're not going to shift funds from their money market hidey-hole, and they're not going to bid up the prices of stocks.
That's why it becomes difficult for stocks to hold gains when sentiment gets overly optimistic. It isn't usually enough to stop a rally, but when it gets stretched and then reverses, it can be more of an issue. That's what we're facing right now.
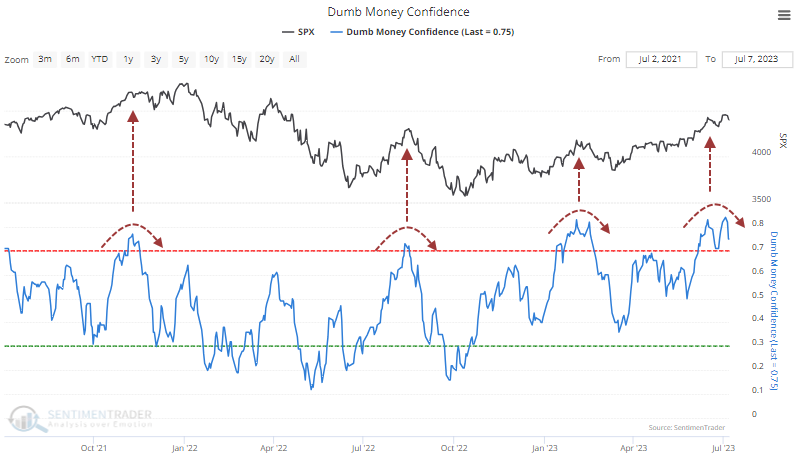
After surging into overly optimistic territory, Dumb Money Confidence has begun to reverse as trend-following traders become less convinced that a further rally is imminent.
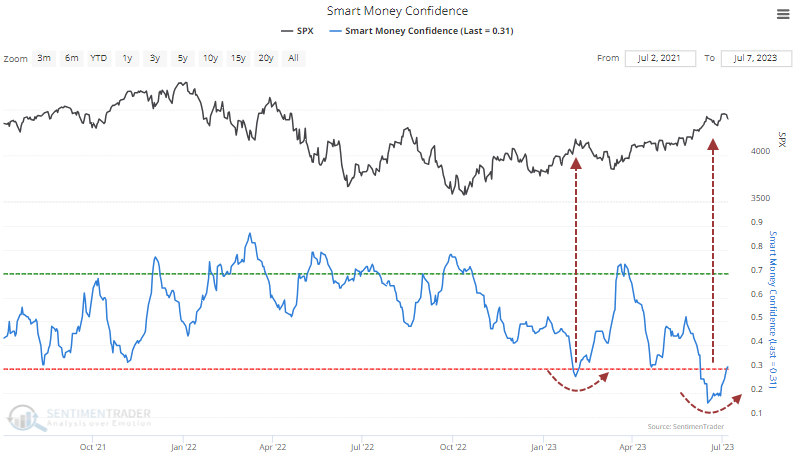
At the same time, Smart Money Confidence is doing what it usually does and is rising from an exceptionally low level. This model comprises indicators that track investors who typically fight a trend, which doesn't sound so smart (and isn't most of the time), but it also means they're usually the best positioned at turning points.
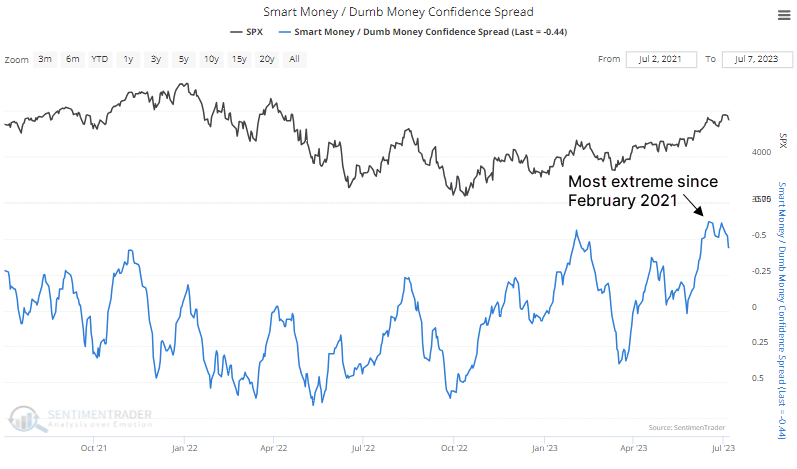
Falling Dumb Money and rising Smart Money means that the spread between the two models is narrowing after blowing out to the most stretched level in over two years. The scale in the chart below is inverted to better align with market extremes.
Those who are intent on being a contrarian just for the sake of being contrarian can stop reading here; we're in a bear market, sentiment is reversing from extreme optimism, and stocks will crash.
Persistent optimism doesn't happen during bear markets
Okay...for the rest of us, it's not so simple.
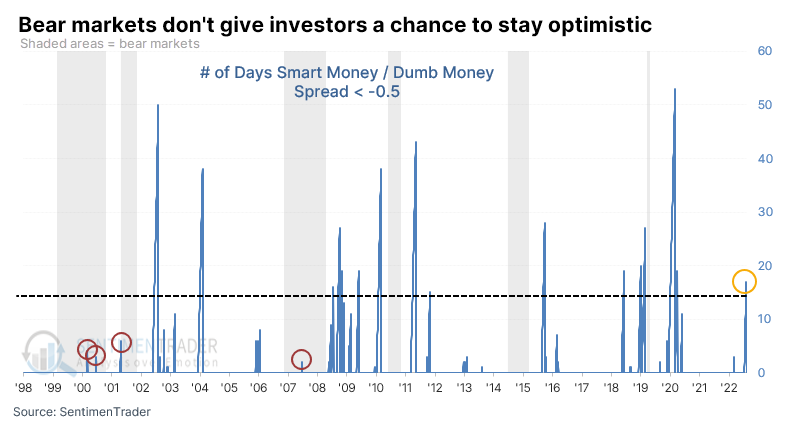
We've been compiling this data since December 1998. What has become clear over those 24+ years is that during ongoing bear markets, investors don't have a chance to become too optimistic - at least not for long - before sellers see their opportunity to offload shares to suckers.
During the 2001-02 and 2007-08 bear markets, the Smart Money / Dumb Money Confidence spread never went beyond two weeks in extreme territory before sellers emerged and stocks tanked. This time, the spread went more than three weeks in extreme territory.
The table below shows those times when the spread exceeded an extreme threshold and stayed there for more than three weeks, then reversed out of it.
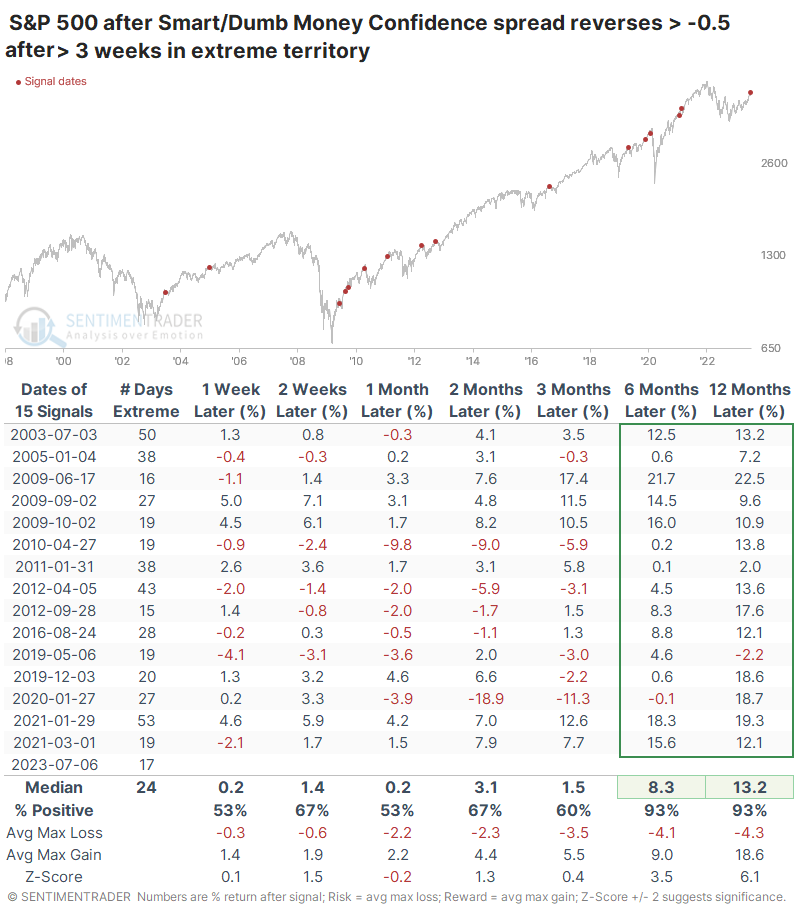
There are a few things that stand out:
- Persistent optimism like this doesn't happen during protracted bear markets
- It can happen right before large corrections
- The first reading following a bear market typically leads to only a short-term pullback
Even though most of the study period is dominated by rising prices, the S&P 500's returns over the six to twelve months following these signals were well above random. There was only a single loss in either time frame, and they were minimal. While it didn't preclude some large losses in the interim, the median maximum loss was well below the median maximum gain.
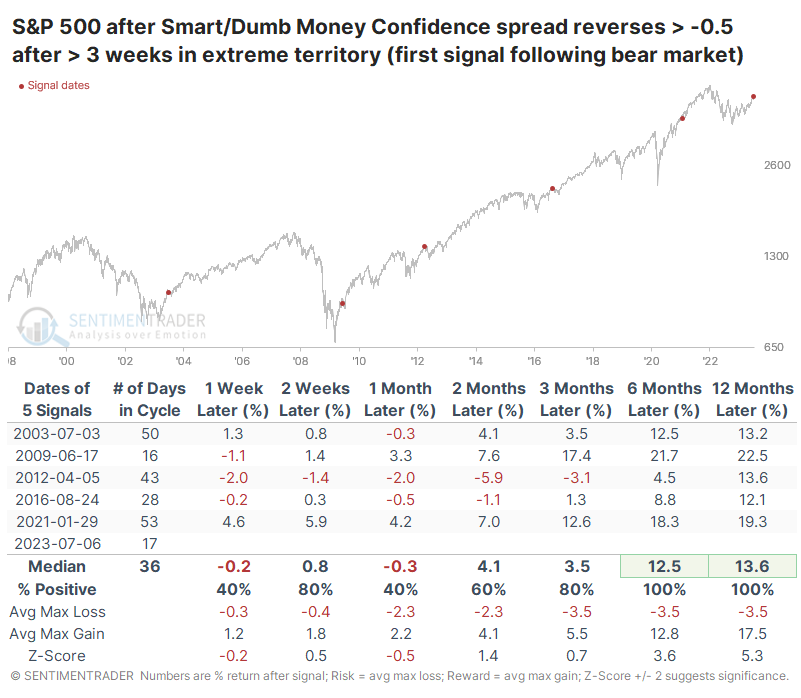
As noted, the first period of protracted extreme sentiment following a bear market has preceded very good long-term returns, with double-digit gains a year later. The biggest caveat (besides the tiny sample size) is that four of the signals saw at least a month of stretched sentiment, so the current streak was a little light in that regard.
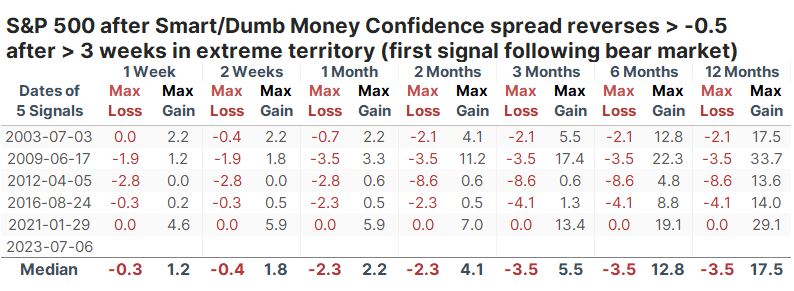
The table of maximum gains and losses across time frames shows limited losses in each case, with no double-digit pullbacks up to a year later after all signals.
What the research tells us...
For contrarian-minded investors, seeing evidence of extreme optimism among other investors always triggers anxiety. During bear markets - and sometimes even weak bull markets - that anxiety is usually rewarded because selling early becomes a gift. Since last summer and especially since the fall, we've gone over a lot of compelling evidence that we were likely in a new bull market environment, and nothing since then has shaken that view by much.
Even the current display of excessive optimism is encouraging (gulp) simply because it lasted so long. During bear markets, this doesn't happen. We've been around long enough and gotten slapped enough times to understand that anything can happen at any time. Based on past behavior, though, it would be unusual to see this pattern roll over into a new protracted bear market.