
Sentiment indicator signals to follow (and an easy way to follow them) - Part II

Key points
- A recent webinar attendee asked, "What are your Top 10 Sentiment Indicators?"
- The correct answer is "There is no such thing."; However, this series will highlight a variety of sentiment indicators that give meaningful signals from time to time
- We also highlight how to add an indicator to your "Favorites" so you can be updated on their status with the click of a button
- This note highlights the Put/Call Premium, ROBO Put/Call Ratio, and the University of Michigan Consumer Confidence indicators
Overview
The indicators detailed below are NOT "ranked" best to worst. They each represent an independent view of market sentiment based on some objective measure. Some indicators give signals fairly frequently, and others very infrequently. The three covered in Part II fall into the "very infrequently" category. However, while they generate signals infrequently, it is typically worth knowing when they do. That is why we have included an example of adding these indicator signals to your Backtest Engine Favorites, so you can be alerted when the next signal occurs.
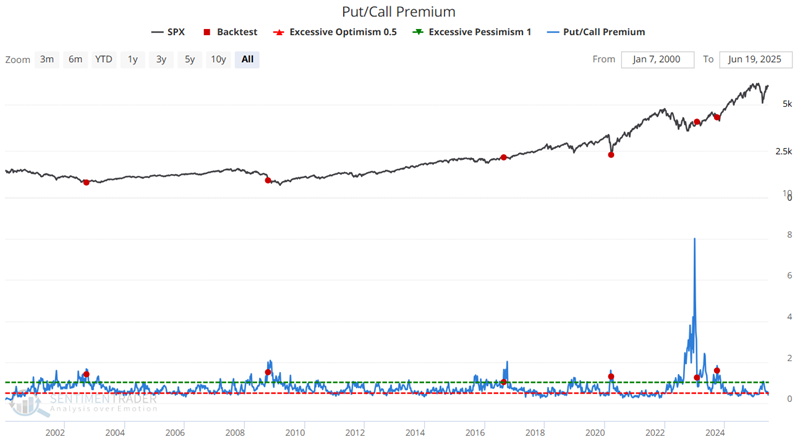
#4. Put/Call Premium
This indicator compares the ratio of total put premiums paid each week to total call premiums paid, so it directly reflects how much options traders are paying for one relative to the other. That makes it an effective measure of real-money, real-time, leveraged sentiment. When it rises to an extreme, it is a highly reliable gauge of option-trader panic.
The chart below highlights those rare occasions when the Put/Call Premium indicator crossed below 1.59 for the first time in 26 weeks.
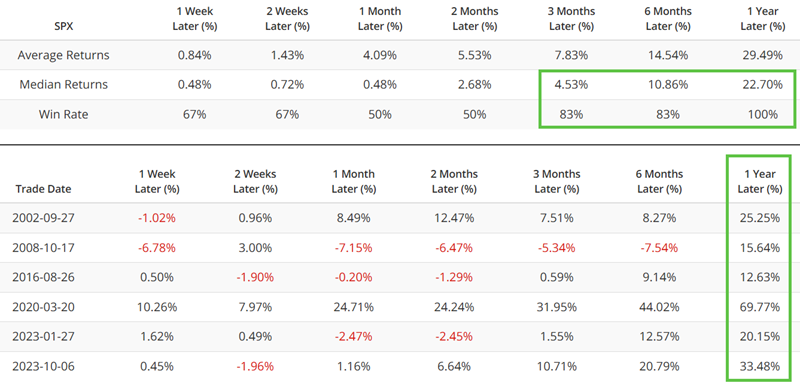
The table below displays S&P 500 performance following the signals shown in the chart above.
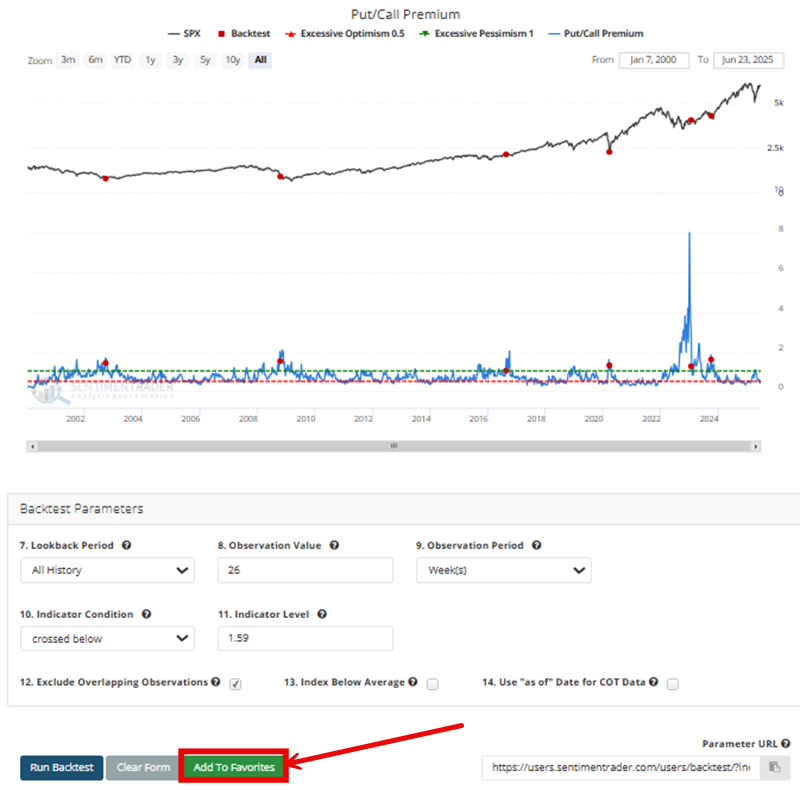
The fact that this indicator signal only triggers once every several years is a definite turnoff for many investors. However, the website allows you to save this signal and automatically alerts you when a signal does occur. We review the steps below.
Saving an indicator for easy review
Want to save a particular indicator signal to find out automatically when it generates a new signal? After you run your test in Backtest Engine 1.0, click "Save to Favorites" at the bottom of the output screen.
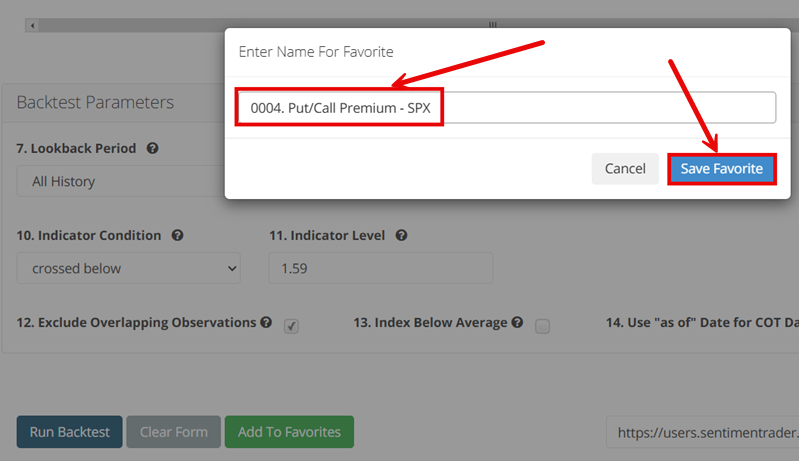
On the next screen, give the indicator signal a name (you might also add a number, but it is not required) and then click "Save Favorite." That's it.
Want to know if any of your saved Favorites have flashed a recent signal? From the main menu, select "Tools", then "Backtest Engine v1.0."
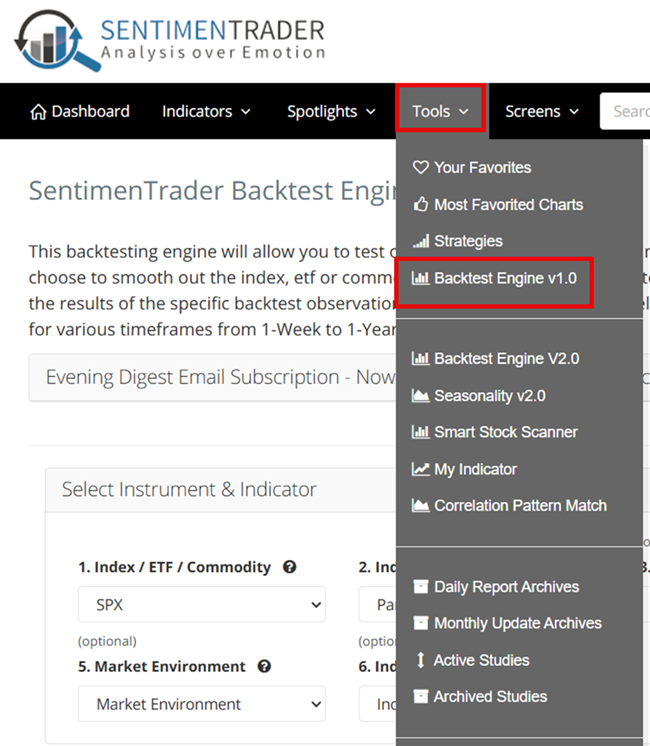
When the "SentimenTrader Backtest Engine" screen appears, scroll down to "Favorites" and click "Find Last Signal." The software will then run through your Saved Favorites and display all recent signals.
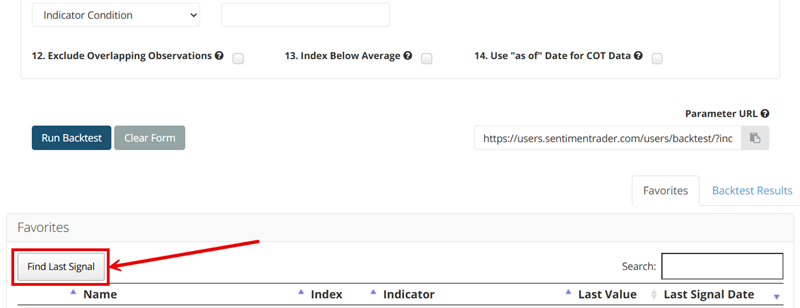
You can run this routine daily, weekly, or anytime you want to view the status of your indicators.
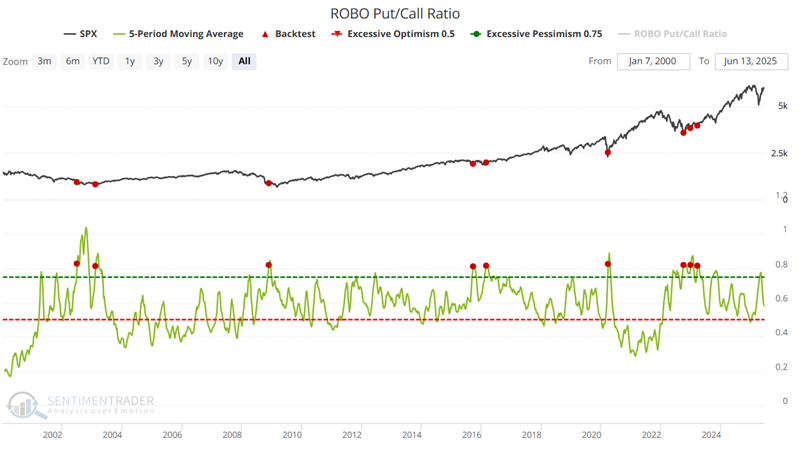
#5. ROBO Put/Call Ratio
ROBO is an acronym we coined for Retail-Only, Buy-to-Open.
This ratio focuses on small traders to better understand what they're trying to do. When looking at put/call information, it is helpful to see if the volume is going into opening or closing transactions, as this will tell us how aggressive the traders are in betting on a market move. Also, especially for very small traders, buying options to open is more telling than selling options to open.
A small trader buys a call option to open a position because he thinks his stock is going higher. He buys a put option to open because he thinks his stock is declining. You may argue that he's trying to hedge some underlying stock position, but it doesn't matter. If he thinks his stock is going up, he won't buy a put just for the thrill of it.
Suppose we isolate the trades to those of 10 contracts or less and further restrict them to buys and opening transactions only. In that case, we can get an accurate picture of what retail traders (i.e., small brokerage firm customers) are doing.
This ratio looks at transactions that are buy-to-open only, and only for those trades that are under 10 contracts. Therefore, it is an excellent read on the emotions of the smallest of traders and should be interpreted in a contrary manner.
When the ROBO put/call ratio is high, small traders buy many puts in relation to calls, suggesting that they believe their stocks will decline. This is bullish for the market once it reaches an extreme. On the other hand, when these traders are so confident of their stocks rising that the ROBO ratio drops to a low level, we need to be aware that sentiment is becoming too frothy, and a market decline may soon be at hand.
The chart below highlights those dates when the 5-week moving average for this indicator crossed above 0.8.
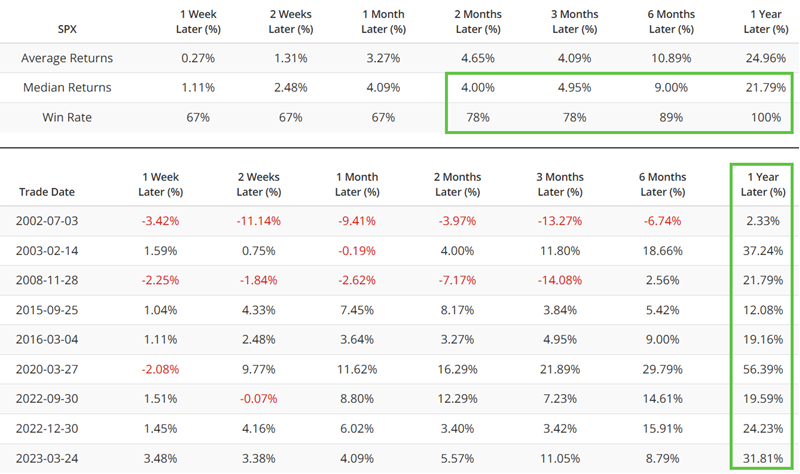
The table below summarizes subsequent S&P 500 performance.
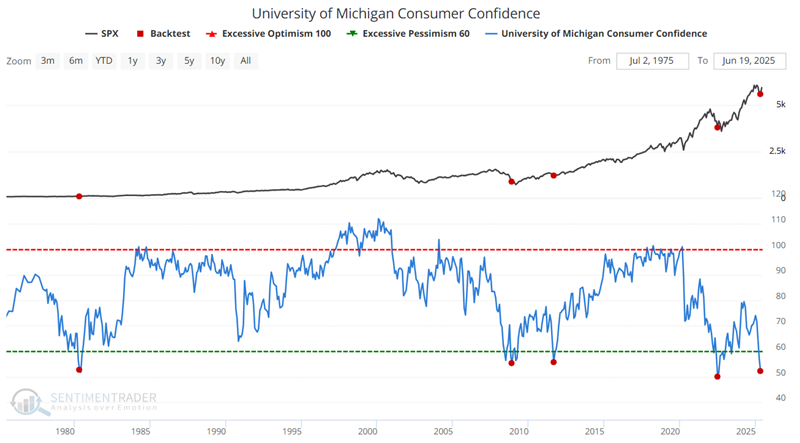
#6. University of Michigan Consumer Confidence
NOTE: This is now known as the Thomson/Reuters University of Michigan Consumer Sentiment Index.
Via Wikipedia: The University of Michigan Consumer Sentiment Index is a consumer confidence index published monthly by the University of Michigan. The index was normalized to 100 in December 1964. George Katona devised the consumer confidence measures in the late 1940s. They have now developed into an ongoing, nationally representative survey based on telephonic household interviews. The Index of Consumer Sentiment (ICS) is developed from these interviews.
It gives a very accurate indication of the national economy's future course. The Index of Consumer Expectations (a sub-index of ICS) is included in the Leading Indicator Composite Index published by the U.S. Department of Commerce, Bureau of Economic Analysis.
The Index was created and still is published with the following objectives:
- Assessment of consumer attitudes on business climate, personal finance, and spending
- To create the capability for understanding and forecasting changes in the national economy
- Directly incorporate empirical measures of consumer expectations into models of behavior
- To forecast the economic expectations and the future spending behavior of the consumer
- To judge the level of optimism/pessimism in the consumer's mind
The Index of Consumer Expectations focuses on three broad areas:
- How consumers view prospects for their own financial situation
- How they view prospects for the general economy over the near term
- Their view of prospects for the economy over the long term
The survey polls approximately 300 consumers for a preliminary figure and 500 for a final figure.
- Like most other sentiment surveys, this is a coincidental indicator. When times are good, consumers are happy; when times are bad, they are less optimistic. The keys to watch for as investors are when divergences occur between sentiment and the stock market, especially times of extreme confidence or pessimism.
- At the extremes, the survey is a decent contrary indicator. When the survey recorded readings over 100, it coincided with economic expansion and good stock market performance. Generally, stocks underperform after such occurrences.
- When the survey recorded readings under 70, it coincided with challenging market conditions. However, by the time consumers recognize and extrapolate this, we're usually nearing the trough, and the stock market tends to bottom not long after.
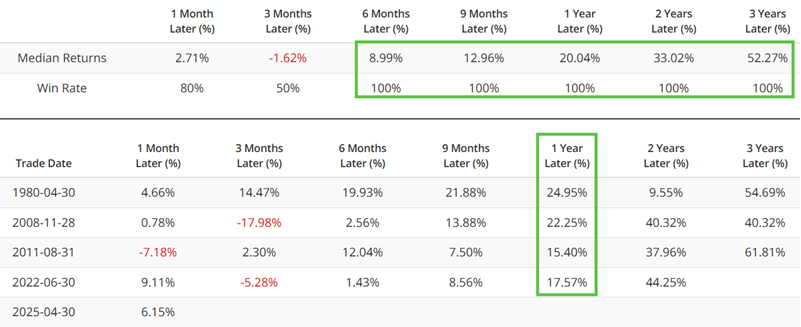
The chart below highlights the rare occasions when this indicator crossed below 56. At the end of April 2025, only the fifth signal since 1980 fired.
The table below summarizes subsequent S&P 500 performance.
What the research tells us…
Not every indicator is meant to be used as a standalone trading system. Likewise, a given sentiment indicator can say nothing for long periods of time. But when it suddenly reaches an extreme, it can say something extremely useful. The indicators highlighted above fit into this category. And the "Favorites" feature allows you to add these - and other - indicators to a list of indicators you can review for any relevant signals at any time.