
Sentiment indicator signals to follow (and an easy way to follow them) - Part I

Key points
- A recent webinar attendee asked, "What are your Top 10 Sentiment Indicators?"
- The correct answer is "There is no such thing."; However, this series will highlight a variety of sentiment indicators that give meaningful signals from time to time that we think investors should pay attention to
- We also highlight how to add an indicator to your "Favorites" so you can be updated on their status with the click of a button
Overview
The indicators detailed below are NOT "ranked" best to worst. They each represent an independent view of market sentiment based on some objective measure. Some indicators give signals fairly frequently, and others very infrequently.
#1. Panic/Euphoria Model
This model is based on the Citi Panic / Euphoria model published in Barron's magazine. It does not reflect those published values; instead, our interpretation of the model inputs and construction differs modestly from the published figures. The inputs are the same; however, its performance as a contrary indicator is improved over the published values. It comprises the following primary inputs: NYSE short interest, margin debt, Nasdaq vs NYSE volume, Investor's Intelligence survey, AAII survey, retail money market funds, put/call ratios, commodities prices, and retail gasoline prices. The higher the model, the more investors are in a euphoric mood, with lower expected stock returns going forward. Low values, particularly below zero, suggest investors have panicked, and higher forward returns are expected.
The chart below highlights all weeks when the Panic/Euphoria Model was below -0.30 (<<<click highlighted text to launch the test. From there, click "Run Backtest." After that, you can save this test to your "Favorites" as detailed below).
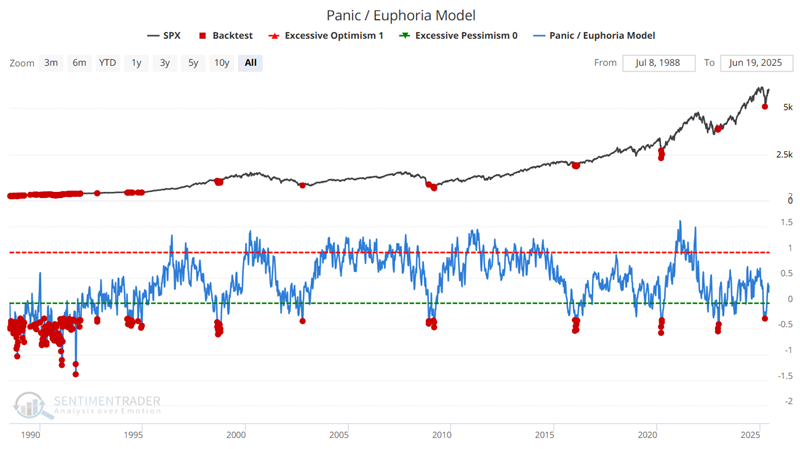
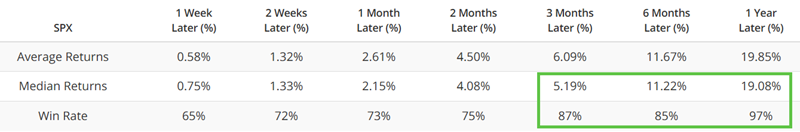
Note that during the late 1980s and early 1990s, the indicator spent almost all its time below -0.30. This is not a bad thing. Except for a handful of signals in late 1989 and early 1990, all signals saw the S&P 500 higher twelve months later. Since then, most signals have coincided with significant market declines/bottoms. The table below reveals this to be a valuable signal for investors with a three-to twelve-month timeframe.
Saving an indicator to "Favorites" for easy review
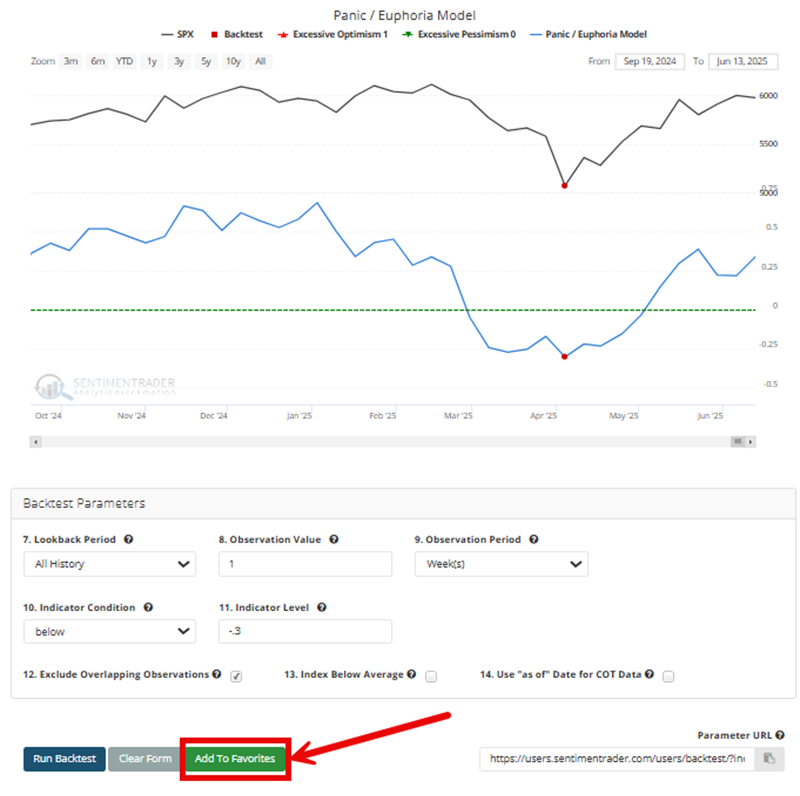
Want to save a particular indicator signal to find out automatically when it generates a new signal? After you run your test in Backtest Engine 1.0, click "Save to Favorites" at the bottom of the output screen.
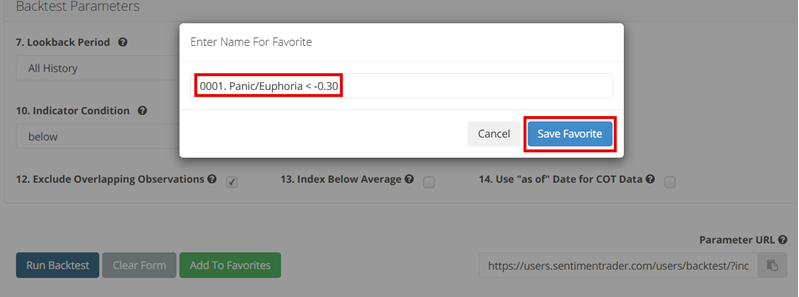
On the next screen, give the indicator signal a name (you might also add a number, but it is not required) and then click "Save Favorite." That's it.
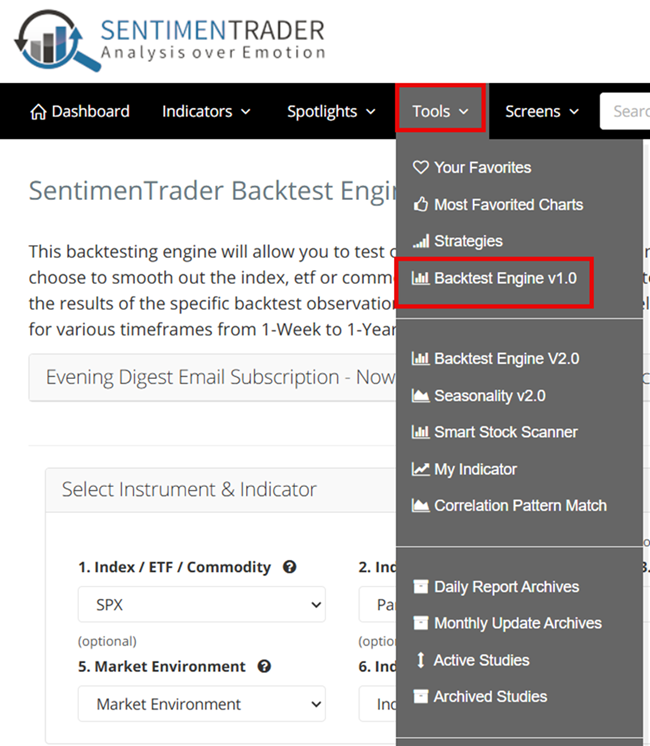
Want to know if any of your saved Favorites have flashed a recent signal? From the main menu, select "Tools", then "Backtest Engine v1.0."
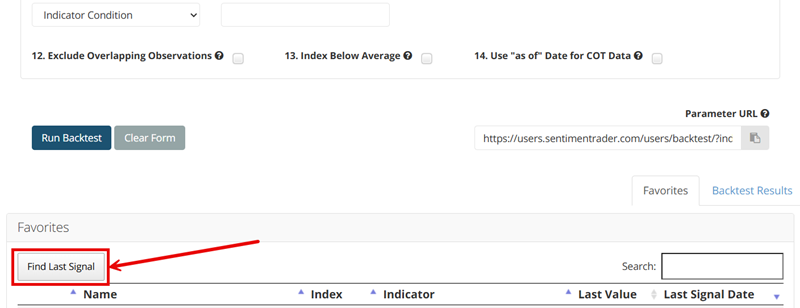
When the "SentimenTrader Backtest Engine" screen appears, scroll down to "Favorites" and click "Find Last Signal." The software will then run through your Saved Favorites and display all recent signals. Doing this daily or weekly allows you to keep apprised of new signals from your favorite indicators.
#2. Sentiment Cycle Composite
Investor sentiment can be complex and cyclical, so we developed the Sentiment Cycle Composite to simplify the analysis of emotional shifts in the market. This new indicator combines four key phases of the sentiment cycle- Enthusiasm, Panic, Discouragement, and Returning Confidence- into a single measure, offering a concise view of market behavior at any given time. Balancing optimism and pessimism helps investors better understand the current emotional state of the market and its historical context.
Enthusiasm: High optimism, easy credit, rush of offerings, risky stocks outperforming, stretched valuations.
Panic: Extreme pessimism, oversold breadth, risky stocks crash, negative media coverage, credit slams shut.
Discouragement: Stocks go nowhere, trend-followers suffer, some pockets of outperformance, credit starts to thaw, and activity slows.
Returning Confidence: Stocks rise choppily, smaller stocks do well, credit becomes easy, and more new offerings are made.
The Sentiment Cycle Composite aggregates these phases, making it easier for investors to spot shifts in market dynamics and assess potential opportunities or risks. Whether the market leans toward optimism or pessimism, this indicator provides a data-driven perspective to help investors form their own views on market conditions and sentiment trends.
The chart below highlights those dates when the Sentiment Cycle Composite crossed above -0.60 (for my own purpose, a cross below -0.60 is an "unfavorable" signal, and a cross above -0.60 is a "favorable" signal for this particular indicator)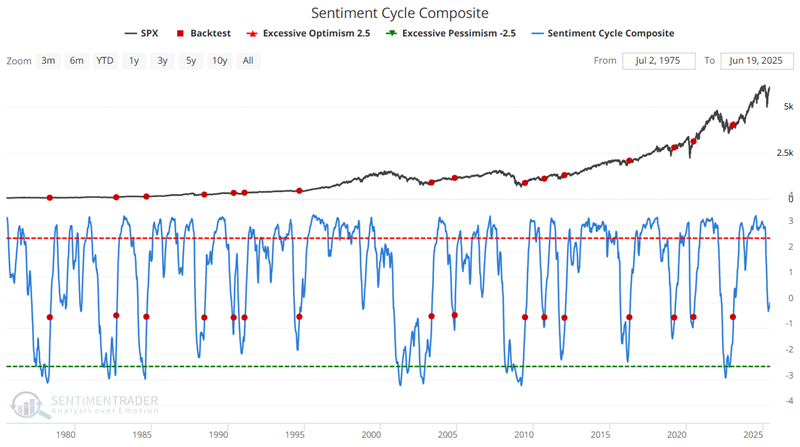
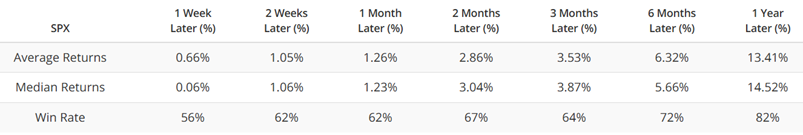
The table below summarizes subsequent S&P 500 performance following all signals since the 1930s.
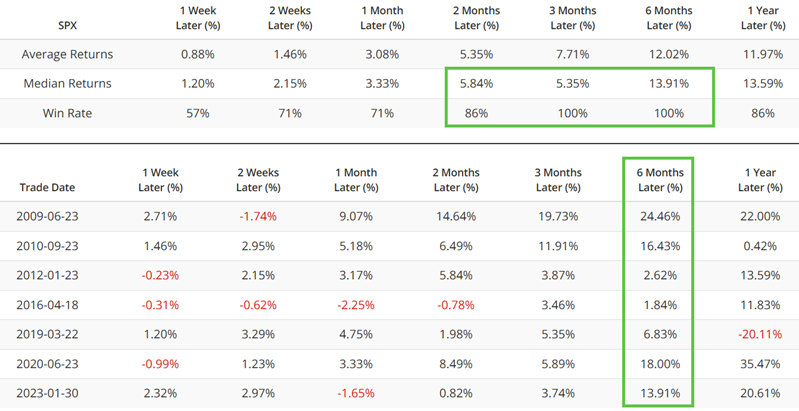
The chart and table below focus only on performance during the last twenty years.
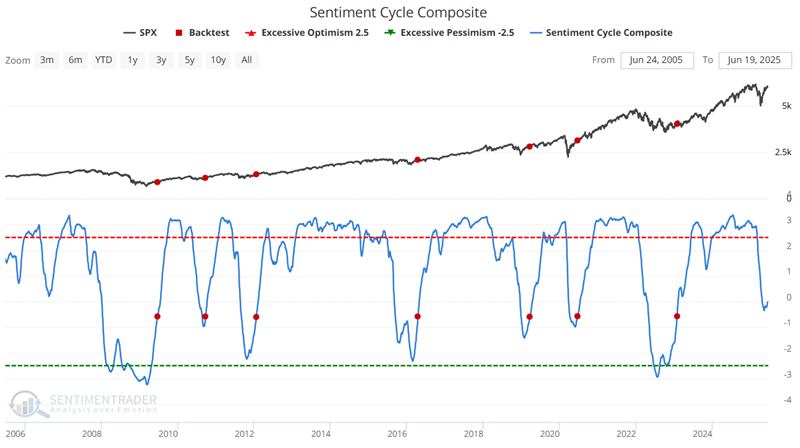
Note that the Sentiment Cycle Composite did not drop below -0.60 during the April 2025 decline and remains "favorable."
If you choose to add this to your Favorites, it makes sense to add two separate Favorites; one for crosses above -0.60 and another for crosses below -0.60.
#3. AAII Bull Ratio
The AAII (American Association of Individual Investors) is a non-profit organization headquartered in Chicago and founded in 1978. Its stated mission is "assisting individuals in becoming effective managers of their own assets through programs of education, information, and research." The AAII is affiliated with NAIC, the organization that helped so many investment clubs start in the late 1990s.
Their niche market is individual investors, not professional traders, pension funds, or anything else institutional. Their focus, and most of their membership, is long-term fundamental analysis of sound companies using a very minimal amount of technical analysis for decision-making purposes.
The AAII sentiment survey is a weekly poll conducted by that organization to gauge the overall sentiment of its membership. It asks its members where they think the market will be in six months and groups the responses into bullish, bearish, or neutral categories.
This indicator is a Bull Ratio, calculated by:
BULL RATIO = (BULLS / (BULLS + BEARS))
Like most contrarian indicators, when the survey shows too many investors as bullish, it often corresponds to market highs. Conversely, too many bears suggest the market may soon find a low.
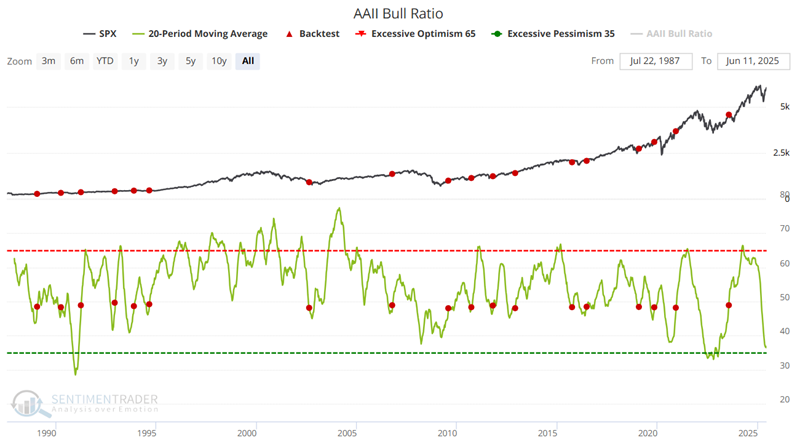
The chart below highlights those occasions when the 20-week average of the AAII Bull Ratio crossed above 0.48 for the first time in six months.
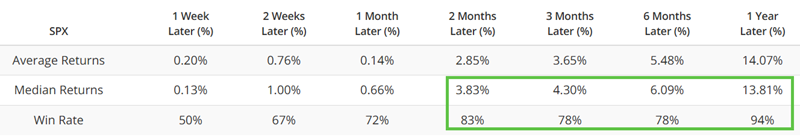
The table below summarizes subsequent S&P 500 performance.
With this indicator's 20-week average well below 0.48, I will watch closely for another cross back above 0.48 as a new "favorable" signal for this indicator.
What the research tells us…
Generally speaking, sentiment indicators tend to be right in the middle but wrong at the extremes. That said, waiting for a reversal off of an extreme can also be helpful - and sometimes safer - before acting. As presented above, the Panic/Euphoria Model signal triggers when sentiment initially reaches an overly bearish extreme. Conversely, the AAII Bulll Ratio indicator presented here looks for a reversal off an extreme before generating a signal. The Sentiment Cycle Composite signal highlighted above uses sentiment on a trend-following basis. These examples demonstrate several sentiment indicators and unique ways to interpret their actions. Also, by following the steps detailed above, each indicator can easily be added to your list of Favorites. This lets you be apprised of any new signal by simply clicking "Find Last Signal" in the Backtest Engine V1.0.