Products
SentimenTrader Trading Tools
‍
Backtest Engine
My Trading Toolkit
Correlation Analysis
Seasonality
Market Prediction
Indicators & Data API
‍
Proprietary Indicators & Charts
Market Data API
Strategies & Scanner
‍
50+ Trading Strategies
Smart Stock Scanner
Smart Option Scanner
Research Reports
‍
Research Solutions
Reports Library
Free Resources
Simple Backtest Calculator
Simple Seasonality Calculator
The Kelly Criterion Calculator
Sentiment Geo Map
Public Research Reports
Education
Sentiment Indicators
Technical Indicators
Pricing
Company
About
In the News
Testimonials
Client Success Stories
Contact
Log inLoginSign up
< BACK TO ALL REPORTS

Sentiment has fully reversed at new highs

by Sentimentrader
2026-05-12
The Smart Money / Dumb Money Confidence spread has rapidly cycled from extreme optimism to pessimism while the S&P 500 sits at all-time highs. Historically, this rare setup has preceded difficult market conditions, though recent resilience suggests caution rather than outright panic.

Key points

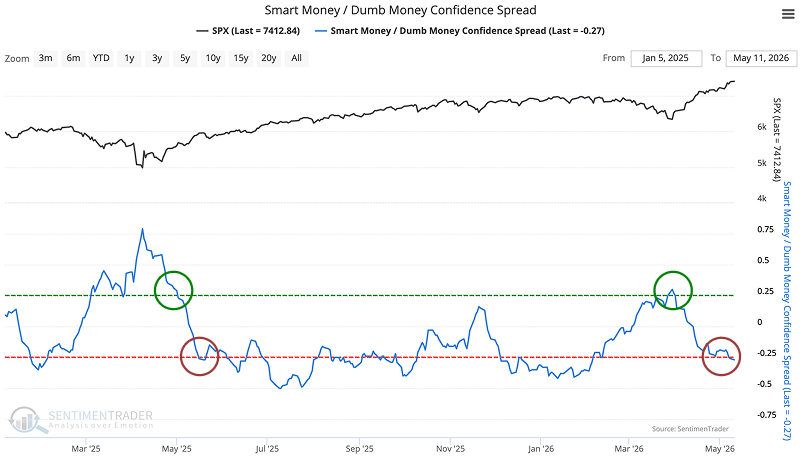
  • The Smart Money / Dumb Money Confidence spread has cycled from above +0.25 to below -0.25
  • The previous cycle in May 2025 resolved with one of the best 6-month rallies in the dataset
  • This time the S&P 500 sits at all-time highs and the cycle was rapid, 31 trading days or less
  • Historically, rapid sentiment cycles at record peaks have led to difficult outcomes

The mood has swung

Here is a tale in two acts. First, from May 2025...

The Smart Money / Dumb Money Confidence spread crossed above +0.25. The S&P 500 sat near 6,000. The signal looked like it might be a problem. Historically, optimism at that level has been a mixed bag...And then a year later, the index had gained 52% over the next six months and kept climbing to 7,412. Now the spread has crossed back below -0.25.

The chart shows the full arc. It was not a slow drift from one extreme to the other. It was a sharp reversal.

The spread isn't all that extreme at -0.27, but it's at least through the lower threshold. Since 1999, the S&P 500 has returned an annualized 17.2% when the spread was above +0.25, 7.7% in the neutral zone, and 4.5% below -0.25. That's less than the other zones, but it's positive. The market has spent 37% of the past 27 yea

Sorry, you don't have access to this report

Upgrade your subscription plan to get access
Go to Dasboard
PRODUCTS
SentimenTrader
Trading Tools
Indicators & Data API
‍
Strategies & Scanner
‍
Research Reports
FREE
RESOUrCES
Simple Backtest
Calculator
Simple Seasonality
Calculator
The Kelly Criterion
Calculator
Sentiment Geo Map
‍
Public Research Reports
‍
Education
Sentiment Indicators
‍
Technical Indicators
‍
Pricing
Bundle pricing
‍
FAQ
‍
Announcements
‍
COMPANY
‍
About
‍
In the News
‍
Testimonials
‍
Client Success Stories
CONTACT
‍
General Inquiries
‍
Media Inquiries
‍
Financial Professionals Inquiries
‍
© 2026 Sundial Capital Research Inc. All rights reserved.
Setsail Marketing
TermsPrivacyAffiliate Program
Risk Disclosure: The information and tools provided are for research and analytical purposes only and are not intended as investment advice. Market analysis involves uncertainty, and outcomes may differ from expectations. Users should conduct their own due diligence and consider their individual circumstances before making any financial decisions. Past performance is not necessarily indicative of future results.

Hypothetical Performance Disclosure: Hypothetical performance results have many inherent limitations, some of which are described below. No representation is being made that any account will or is likely to achieve profits or losses similar to those shown; in fact, there are frequently sharp differences between hypothetical performance results and the actual results subsequently achieved by any particular trading program. One of the limitations of hypothetical performance results is that they are generally prepared with the benefit of hindsight. In addition, hypothetical trading does not involve financial risk, and no hypothetical trading record can completely account for the impact of financial risk of actual trading. for example, the ability to withstand losses or to adhere to a particular trading program in spite of trading losses are material points which can also adversely affect actual trading results. There are numerous other factors related to the markets in general or to the implementation of any specific trading program which cannot be fully accounted for in the preparation of hypothetical performance results and all which can adversely affect trading results.

Testimonial Disclosure: Testimonials appearing on this website may not be representative of other clients or customers and is not a guarantee of future performance or success.