
Sentiment extremes suggest better days ahead for stocks

Key Points
- Our Panic/Euphoria model reached a bearish extreme and has now reversed
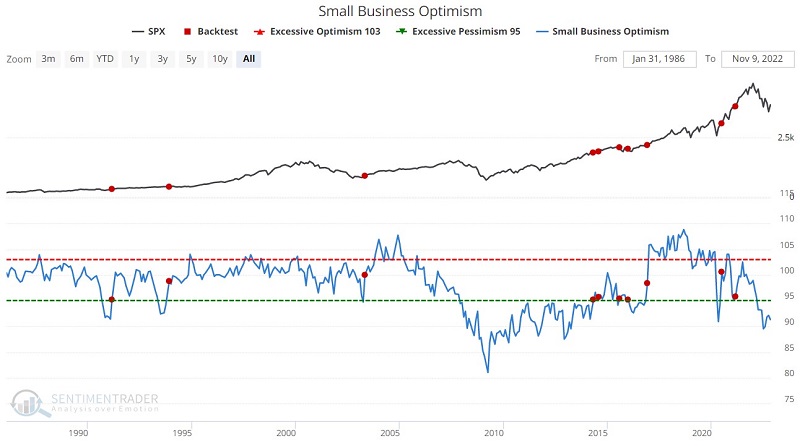
- Small business optimism has fallen to a level that higher stock prices have typically followed in the year ahead
- Overly bearish sentiment is an alert to investors to keep an open mind and look for buying opportunities
The Panic/Euphoria model reverses from an extreme reading
Some long-term models are starting to turn up from extreme pessimism.
Our Panic/Euphoria model is based on the Citi Panic / Euphoria model published in Barron's magazine. It does not reflect those published values. Instead, our interpretation of the model inputs and construction differs modestly from the published figures.
The primary inputs are NYSE short interest, margin debt, Nasdaq vs. NYSE volume, Investor's Intelligence survey, AAII survey, retail money market funds, put/call ratios, commodities prices, and retail gasoline prices.
Like most sentiment surveys, this is generally a contrarian indicator when it reaches extreme readings. Higher readings reflect investor euphoria, and lower readings highlight investor panic. What is especially useful as a market tell is when the indicator reverses higher from an extremely low reading.
The chart and table below highlight S&P 500 performance after the Panic/Euphoria Model crossed back above -0.17 which it recently did.
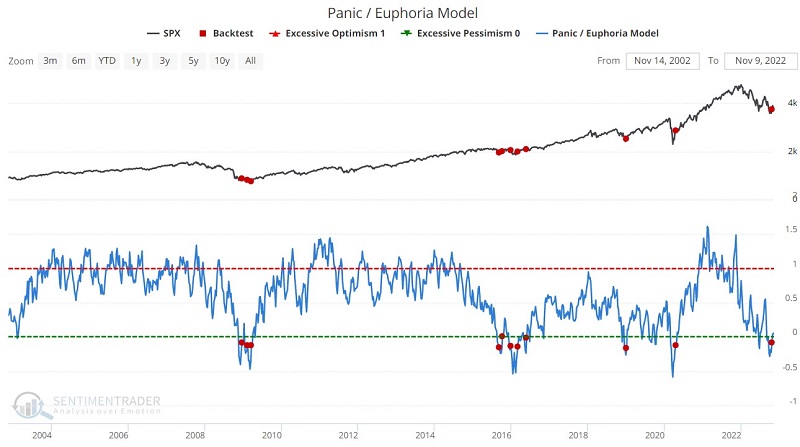
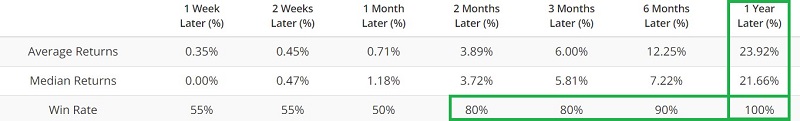
Like many sentiment indicators, signals may not necessarily market the exact bottom in the stock market. But they invariably suggest better days ahead and send a bullish message to investors.
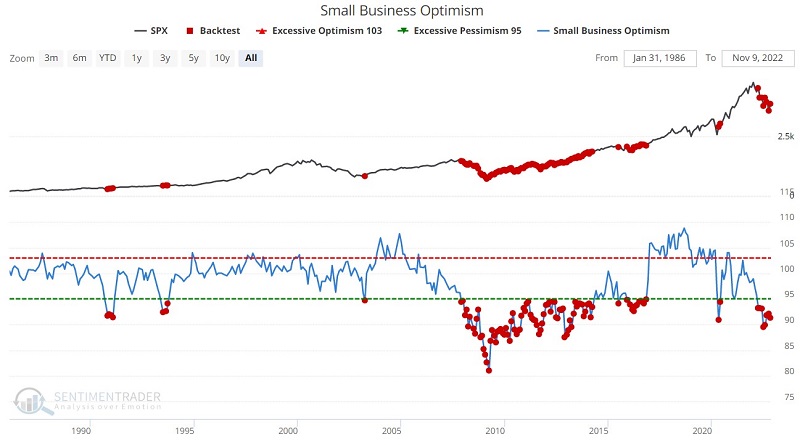
Small Business Optimism reaches an extreme
The National Federation of Independent Business is the leading small business association representing small and independent businesses. Founded in 1943, NFIB represents the consensus views of its members in Washington and all 50 state capitals.
NFIB's mission is to promote and protect the right of our members to own, operate and grow their businesses. The NFIB polls its members on several areas related to their businesses. When the Index of Small Business Optimism is above 100, it indicates an expansionary mode for small business GDP. Like most sentiment surveys, this is typically a coincident indicator until it reaches an extreme and - even better - when it reverses.
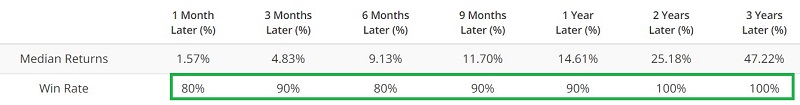
The chart and table below highlight those times when this Small Business Optimism Index was below 95. The market tends to be favorable following such readings. However, it was also painfully early in 2007-2008 and 2022.
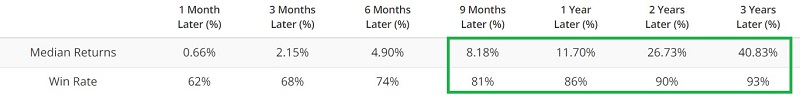
Now let's look at those times when this indicator reversed to the upside from a low reading. The chart and table below highlight those times when this Small Business Optimism index crossed above 95, indicating an upside reversal following an unfavorable extreme. It hasn't yet been triggered but will be something to watch in the months ahead.
What the research tells us…
The implication of the information above is that sentiment has reached a level that has typically been followed by favorable stock market action in the following year. These signals do not preclude the potential for further weakness in the interim. But the bottom line is that investors should be open to - and looking for - opportunities to put money into stocks.