Products
SentimenTrader Trading Tools
‍
Backtest Engine
My Trading Toolkit
Correlation Analysis
Seasonality
Market Prediction
Indicators & Data API
‍
Proprietary Indicators & Charts
Market Data API
Strategies & Scanner
‍
50+ Trading Strategies
Smart Stock Scanner
Smart Option Scanner
Research Reports
‍
Research Solutions
Reports Library
Free Resources
Simple Backtest Calculator
Simple Seasonality Calculator
The Kelly Criterion Calculator
Sentiment Geo Map
Public Research Reports
Education
Sentiment Indicators
Technical Indicators
Pricing
Company
About
In the News
Testimonials
Client Success Stories
Contact
Log inLoginSign up
< BACK TO ALL REPORTS

Sentiment clashes with the aggregate trend

by Sentimentrader
2026-04-07
The S&P 500 faces conflicting signals: technical breadth warns of a multi-month drawdown, while a rare 225-day Smart Money/Dumb Money spread breakout shows 100% 12-month win rate historically, though the small sample size limits statistical certainty.

Key points

  • Aggregate Signal Model CrossBelow 0.45
  • Smart/Dumb Money Confidence Spread 5-DMA CrossAbove 0.25
  • Sentiment lasts for 225 trading days

Aggregate breakdown

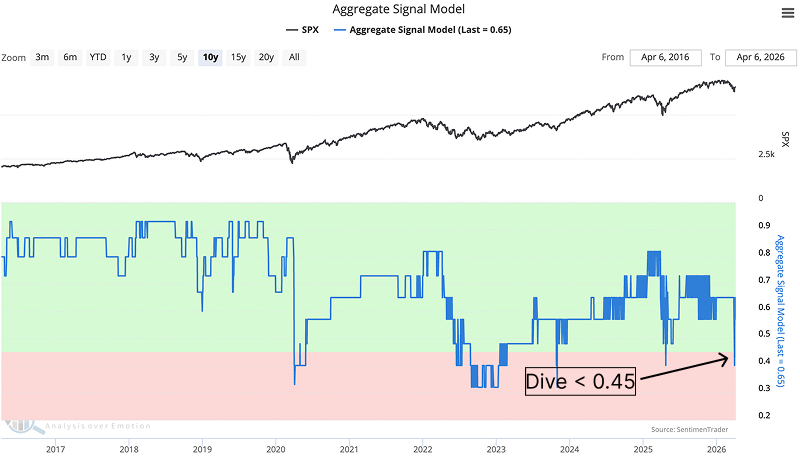
The Aggregate Signal Model just breached the 0.45 threshold. This composite of twelve core indicators is designed to maximize long exposure when trends are healthy and force de-risking when participation narrows. Dropping below 45% suggests a structural deterioration in the broader market.
Sentiment clashes with the aggregate trend

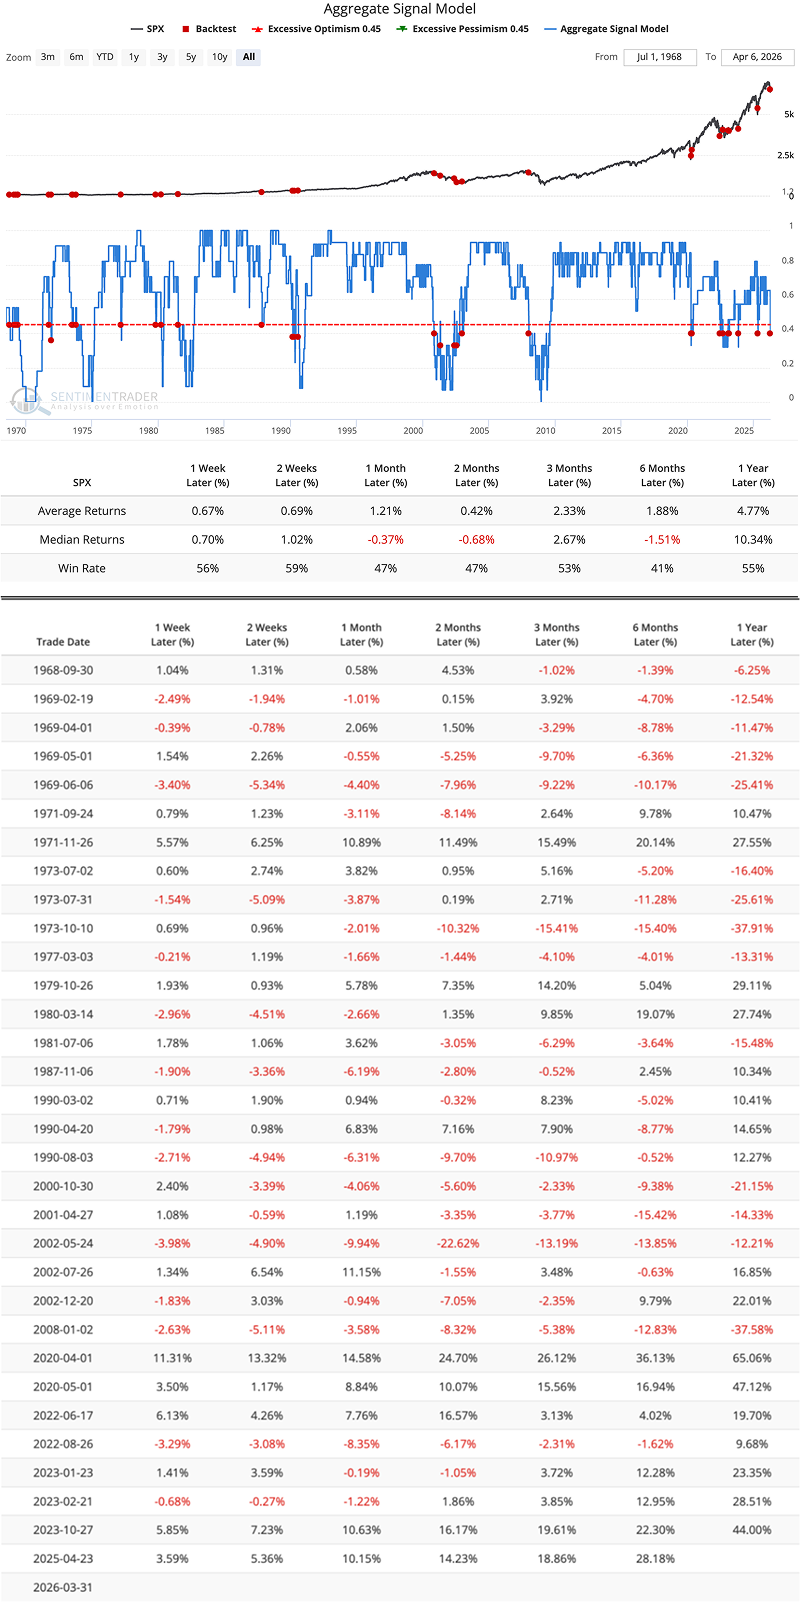
The historical path following these breaks is largely negative. Looking six months out, the S&P 500 was higher just 41% of the time, carrying a median loss of 1.5%. Short-term momentum favors the downside.
Sentiment clashes with the aggregate trend

Smart money steps in

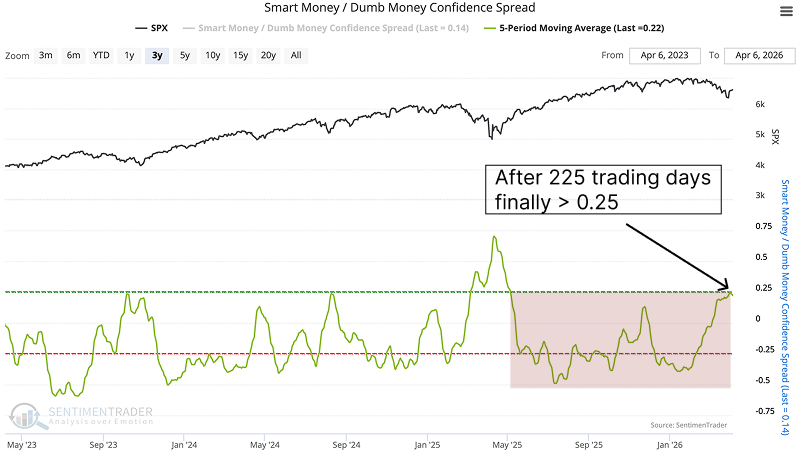
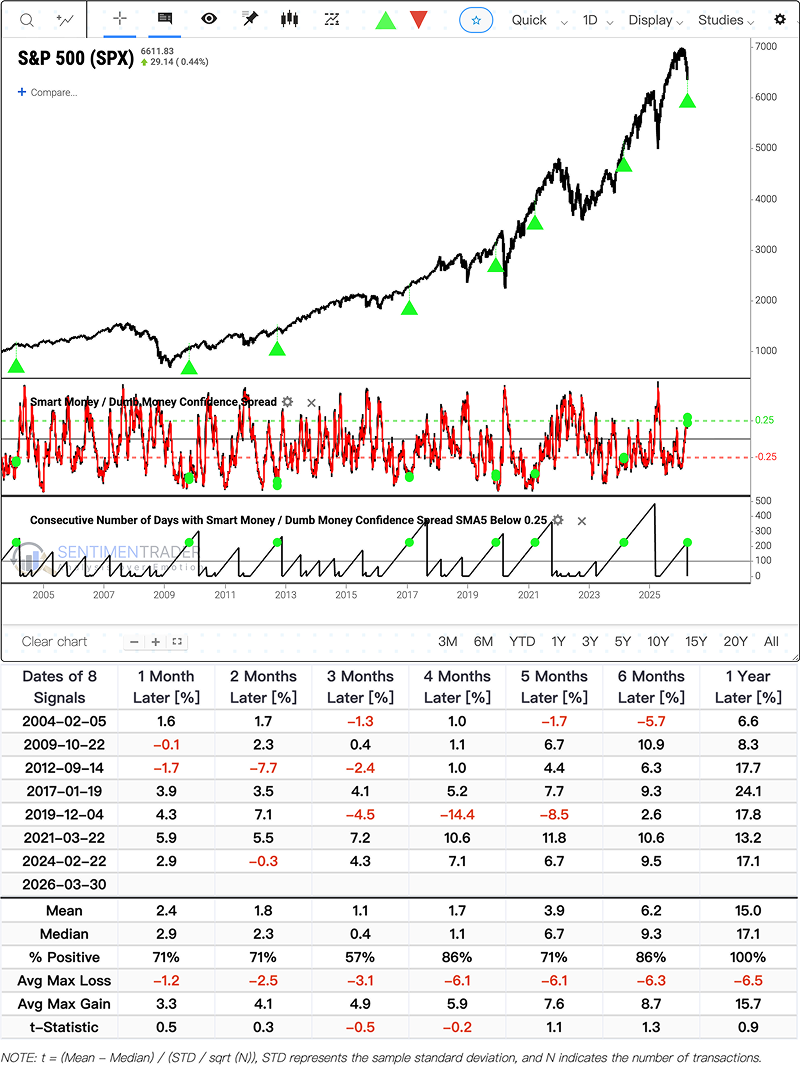
The catch is the sentiment beneath the surface. The 5-period moving average of the Smart Money / Dumb Money Confidence Spread crossed above 0.25 on March 30.
Sentiment clashes with the aggregate trend

This terminates a 225-trading-day stretch where institutional confidence sat persistently below trend-following retail optimism. Commercial hedgers and options professionals are now aggressively positioning against the recent weakness. View the backtest details.
Sentiment clashes with the aggregate trend

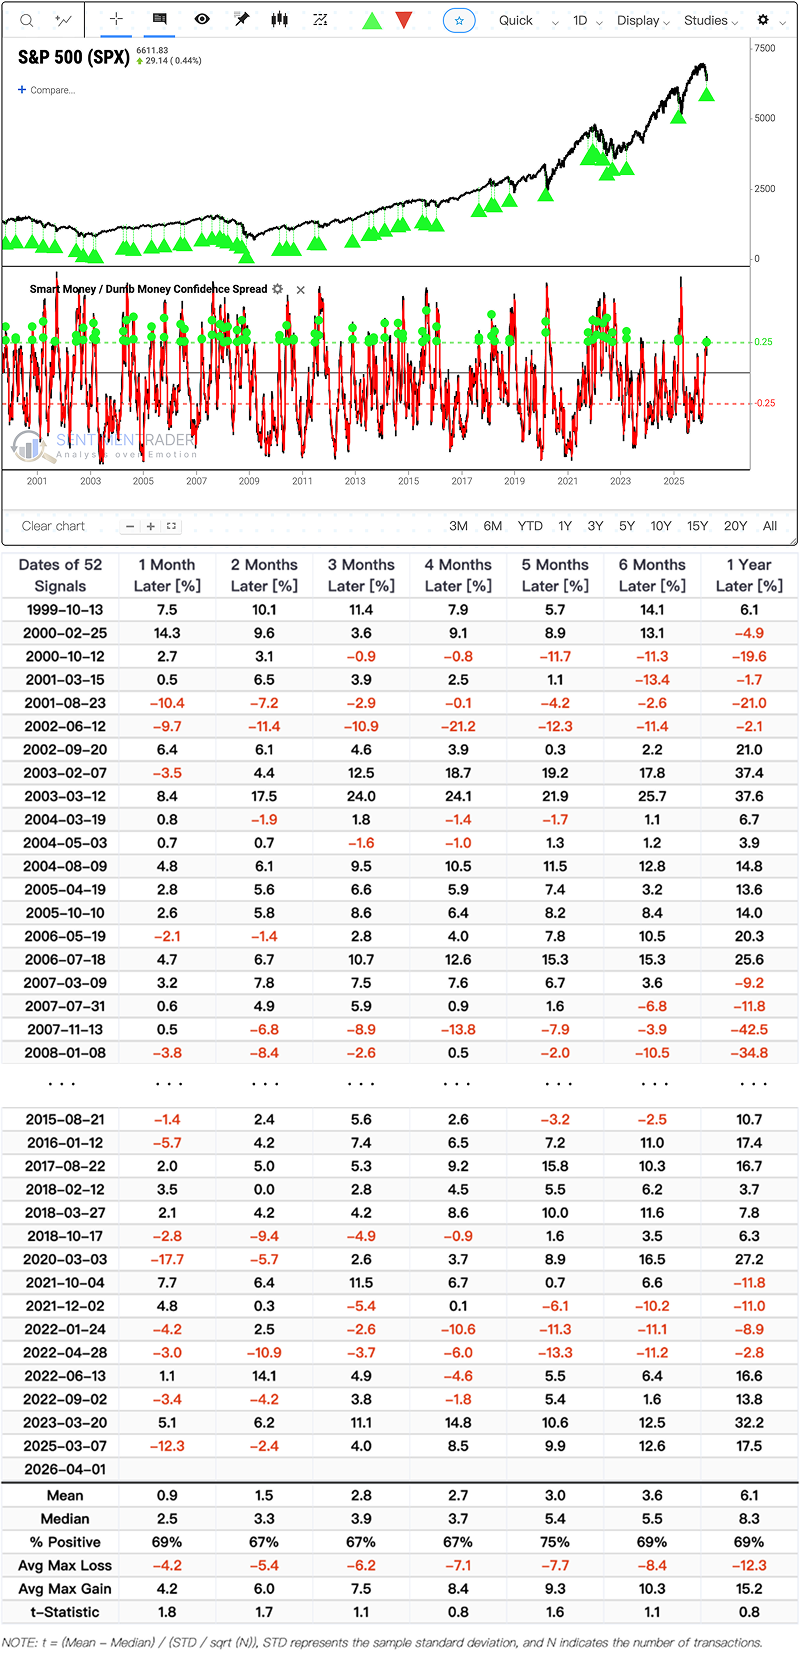
Also, We have only seen seven prior signals where the spread stayed suppressed for this long before surging. View the backtest details.
Sentiment clashes with the aggregate trend

Those seven prior instances heavily favor the bulls over a longer horizon.As usual, this small sample size of seven historical signals lacks strong statistical significance and should be viewed as just one perspective among many.

A year after the signal, the index was higher 100% of the time. The average gain exceeded 15%. Even at the six-month mark, the S&P 500 posted positive returns in seven of the seven cases.

What the research tells us...

We are left staring at two conflicting historical composites. A broad technical aggregate warns of a multi-month drawdown. A targeted behavioral spread implies a rare buying opportunity. The strength of the smart money signal relies on the extremity of its 225-day setup holding true to form in a new macro regime. The current policy backdrop differs materially from the average historical signal window, which was heavily anchored in a zero-rate environment.

PRODUCTS
SentimenTrader
Trading Tools
Indicators & Data API
‍
Strategies & Scanner
‍
Research Reports
FREE
RESOUrCES
Simple Backtest
Calculator
Simple Seasonality
Calculator
The Kelly Criterion
Calculator
Sentiment Geo Map
‍
Public Research Reports
‍
Education
Sentiment Indicators
‍
Technical Indicators
‍
Pricing
Bundle pricing
‍
FAQ
‍
Announcements
‍
COMPANY
‍
About
‍
In the News
‍
Testimonials
‍
Client Success Stories
CONTACT
‍
General Inquiries
‍
Media Inquiries
‍
Financial Professionals Inquiries
‍
© 2026 Sundial Capital Research Inc. All rights reserved.
Setsail Marketing
TermsPrivacyAffiliate Program
Risk Disclosure: The information and tools provided are for research and analytical purposes only and are not intended as investment advice. Market analysis involves uncertainty, and outcomes may differ from expectations. Users should conduct their own due diligence and consider their individual circumstances before making any financial decisions. Past performance is not necessarily indicative of future results.

Hypothetical Performance Disclosure: Hypothetical performance results have many inherent limitations, some of which are described below. No representation is being made that any account will or is likely to achieve profits or losses similar to those shown; in fact, there are frequently sharp differences between hypothetical performance results and the actual results subsequently achieved by any particular trading program. One of the limitations of hypothetical performance results is that they are generally prepared with the benefit of hindsight. In addition, hypothetical trading does not involve financial risk, and no hypothetical trading record can completely account for the impact of financial risk of actual trading. for example, the ability to withstand losses or to adhere to a particular trading program in spite of trading losses are material points which can also adversely affect actual trading results. There are numerous other factors related to the markets in general or to the implementation of any specific trading program which cannot be fully accounted for in the preparation of hypothetical performance results and all which can adversely affect trading results.

Testimonial Disclosure: Testimonials appearing on this website may not be representative of other clients or customers and is not a guarantee of future performance or success.