
Sentiment and breadth throw some shade on gold miners

Key points
- In recent months, gold broke out to a new all-time high; Much speculation argues that this is just the beginning of a massive run
- By association, many are wondering if gold mining stocks will "join the party"
- A series of recent sentiment and breadth indicators suggest caution regarding miners - and possibly a better outcome for commodities
- The message is not "bearish on gold stocks" as much as "there may be better opportunities elsewhere"
Gold stocks have yet to follow gold in a meaningful way
Gold recently broke out to new all-time highs, as shown in the chart below.
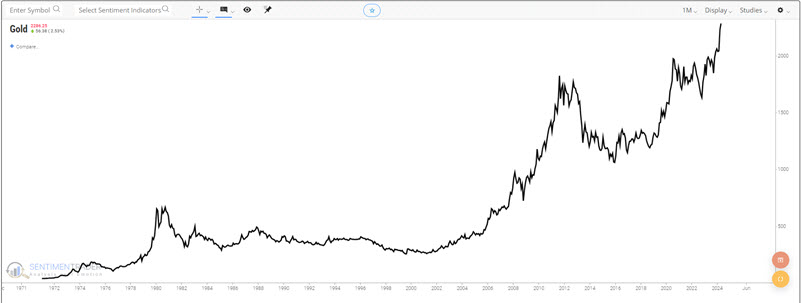
Many pundits have argued that this breakout marks the start of a new run to sharply higher ground. We have no way to predict if this assertion will prove accurate or not. Nevertheless, we definitely have to respect the trend.
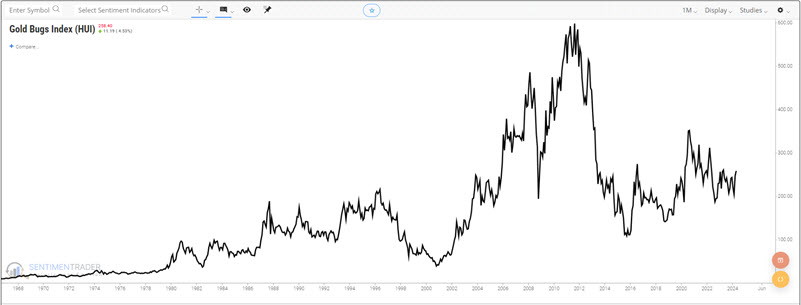
Meanwhile, many also wonder if gold mining stocks will join the rally. In the chart below, we find that the Gold Bugs Index (ticker HUI) of mining companies has yet to follow the lead of gold bullion and remains well off of its all-time high.
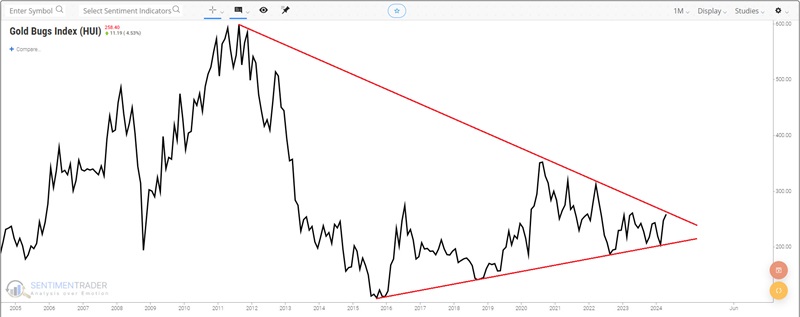
If gold bullion continues to rally, gold stocks will likely rally higher in conjunction. The odds of a run-up in gold miners would likely improve if they can break out to the upside of the long-term narrowing shown in the chart below (and stay there).
Nevertheless, in the meantime, various sentiment and breadth indicators have flashed generally unfavorable signals for gold miners. Interestingly, these signals have been much more favorable for commodities as an asset class.
Let's take a closer look.
GDX Optix spikes in an uptrend
For the tests below, we will use the Gold Bugs Index (ticker HUI) to analyze gold stock miner performance and the Bloomberg Commodity Index (ticker BCOMSP) to analyze commodity performance.
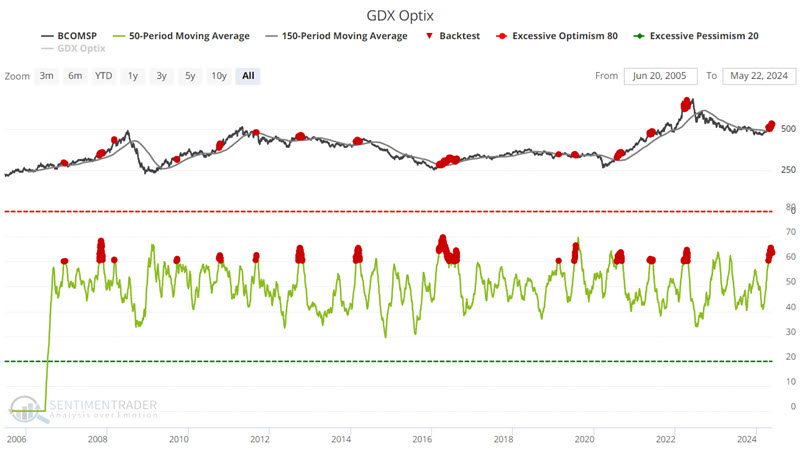
The chart below highlights with a red dot those dates when the 50-day moving average of GDX Optix is above 60% while ticker HUI was above its 150-day moving average.
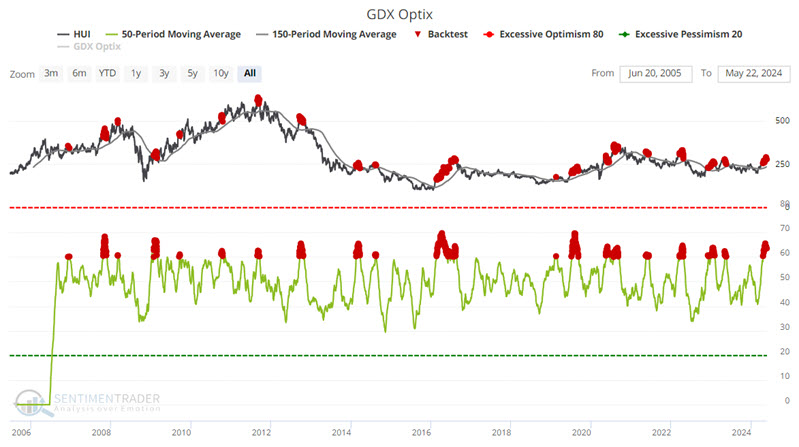
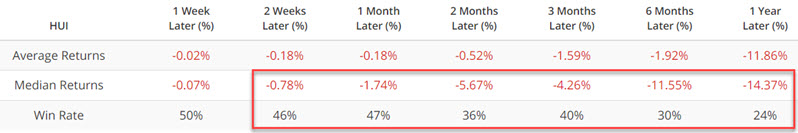
The table below summarizes HUI performance following the signals in the chart above. The most recent signal occurred on 2024-05-22.
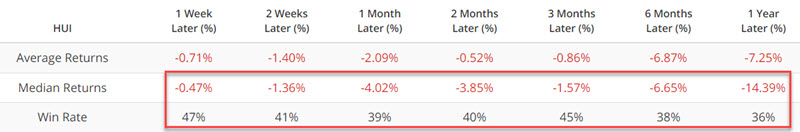
The Win Rate is below 50% for all timeframes, and Median Returns are negative.
The chart below highlights with a red dot those dates when the 50-day moving average of GDX Optix is above 60% while ticker BCOMSP was above its 150-day moving average.
The table below summarizes BCOMSP performance following the signals in the chart above.
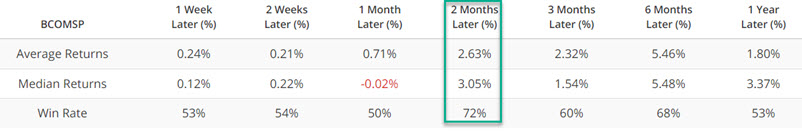
The results above are only mildly compelling but much better than those for gold stocks.
GDX % in Bear Market plunges
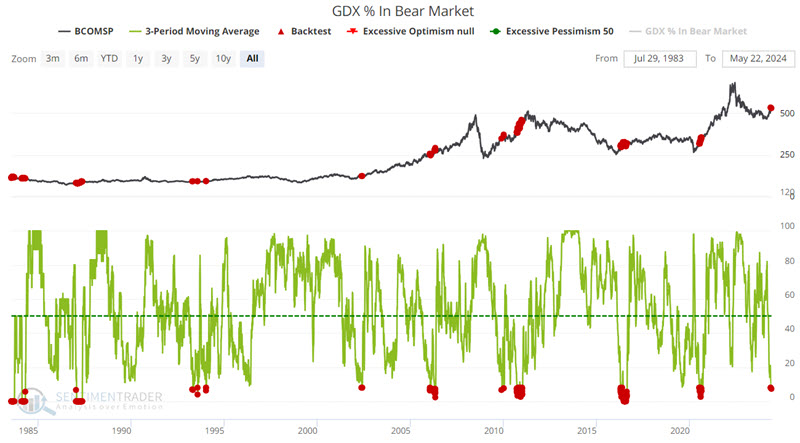
The chart below highlights with a red dot those dates when our GDX % in Bear Market indicator is 8% or lower.
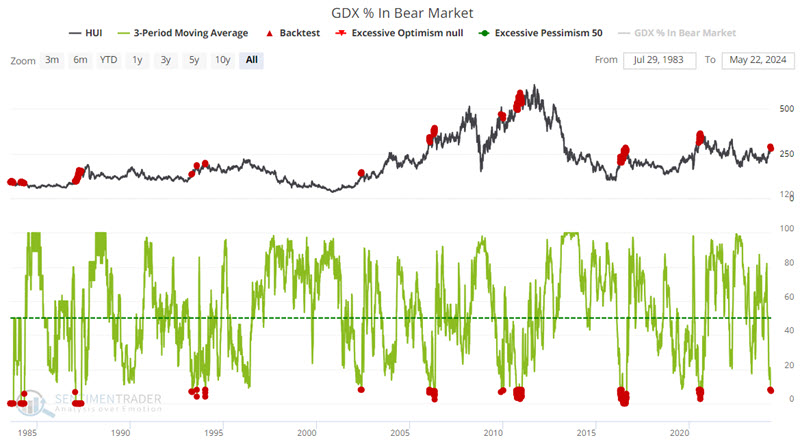
The table below summarizes HUI performance following the signals in the chart above.
The Win Rate is 50% or lower for all timeframes, and the Median Returns are negative. The 12-month performance is particularly subpar, with a 24% Win Rate and a Median Return of -14.37%.
Using BCOMSP as the underlying index, the chart below highlights with a red dot those dates when the GDX % in Bear Market is 8% or lower.
The table below summarizes BCOMSP performance following the signals in the chart above.
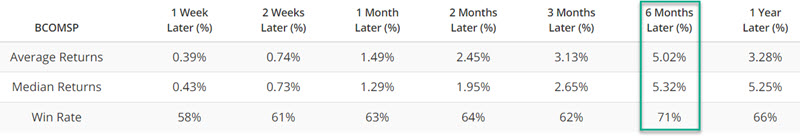
Once again, the results above are only mildly compelling, but they are much better than those for gold stocks.
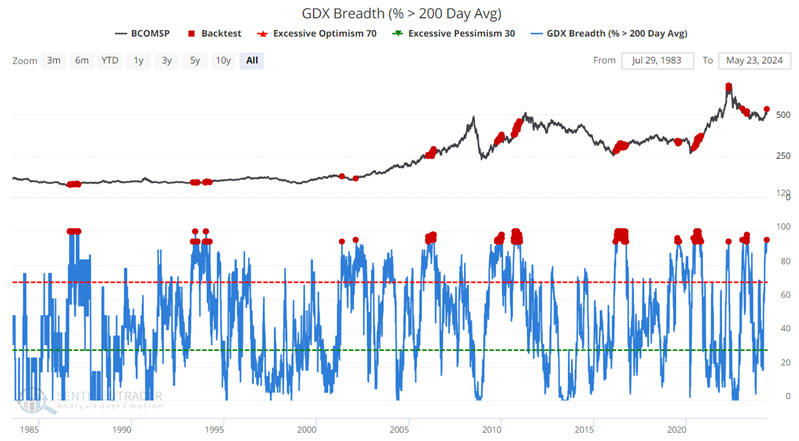
GDX Breadth (% > 200 Day Avg) spikes
Using HUI as the underlying index, the chart below highlights with a red dot those dates when the GDX Breadth (% > 200 Day Avg) is 94% or higher.
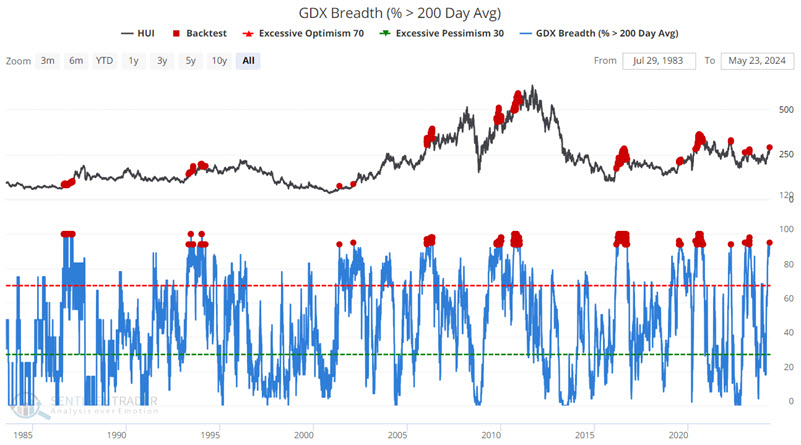
The table below summarizes HUI performance following the signals in the chart above.
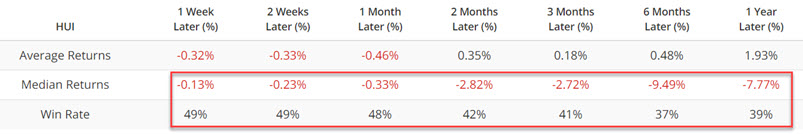
Once again, the Win Rate is less than 50% for all timeframes, and the Median Returns are negative. Six-month performance is particularly subpar, with a 37% Win Rate and a Median Return of -9.49%.
Using BCOMSP as the underlying index, the chart below highlights with a red dot those dates when the GDX Breadth (% > 200 Day Avg) is 94% or higher.
The table below summarizes BCOMSP performance following the signals in the chart above.
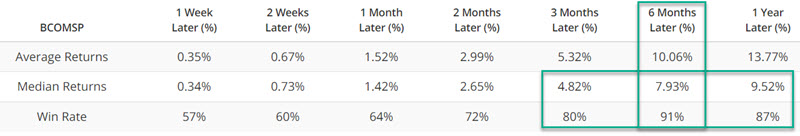
Win Rates for three months and out are above 80%, with a 91% Win Rate for six months.
What the research tells us…
The message from the data above is NOT necessarily that "gold stocks should be sold and/or avoided." The real message is simply that there may be better opportunities elsewhere. If the gold rally is real, it would only be logical to expect gold mining stocks to follow suit at some point. Nevertheless, we can't predict if gold will follow through or if gold mining stocks will experience a sympathy rally. We can state two things: a) gold miners have shown a tendency to exhibit below-average performance in the twelve months following the signals highlighted above, and b) commodities as an asset class have been a better bet.