
Sentiment and breadth continue to point higher

Key points
- The stock market has been on a run since a brief pullback in April
- Several technical indicators suggest the rally could continue
- Investor skepticism remains in pockets of the market, and the recent oversold status for the S&P 1500 tends to be followed by higher prices for a number of months
Investor skepticism remains despite the rally
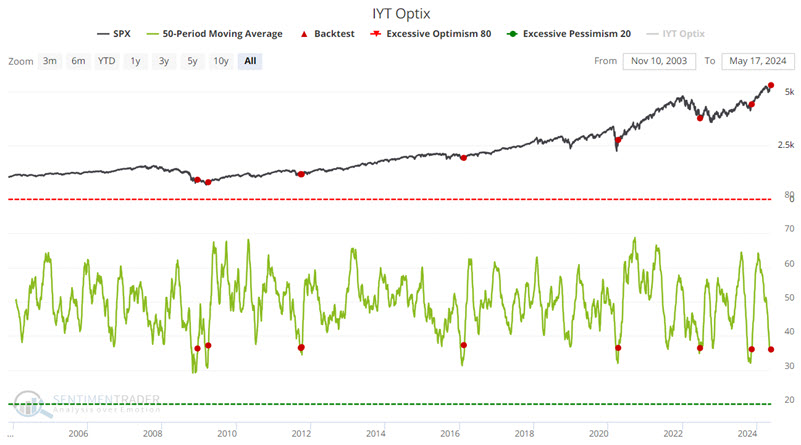
Despite the strength in the stock market over the last month and last year and a half, there remains a healthy dose of skepticism among investors. One place this doubt has manifested itself is in the transportation sector.
The iShares U.S. Transportation ETF (ticker IYT) seeks to track the investment results of an index composed of U.S. equities in the transportation sector. Using the S&P 500 as the tracking index, the chart below highlights with red dots the dates on which the 50-day average of our IYT Optix indicator has crossed above 36 for the first time in three months. The most recent signal occurred on 2024-05-17.
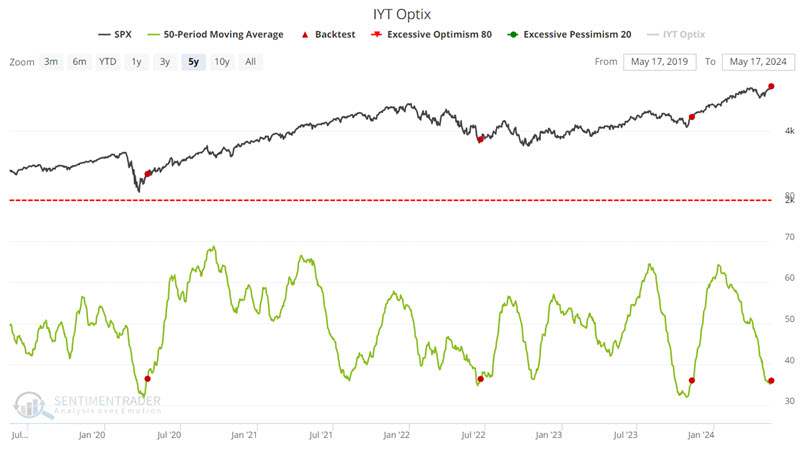
The chart below zooms in on the last five years. While there is no guarantee following the latest signal, note the immediate follow-through that followed recent signals. This suggests that investors continue to give the bullish case the benefit of the doubt.
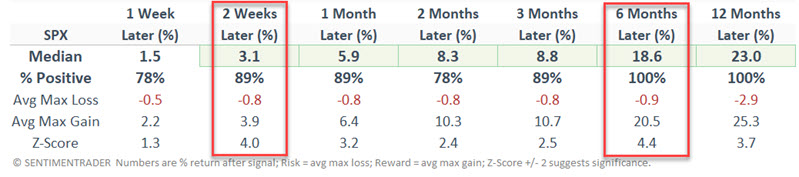
The table below summarizes the S&P 500's performance following the abovementioned signals. The most consistent periods of performance were two weeks and six months.
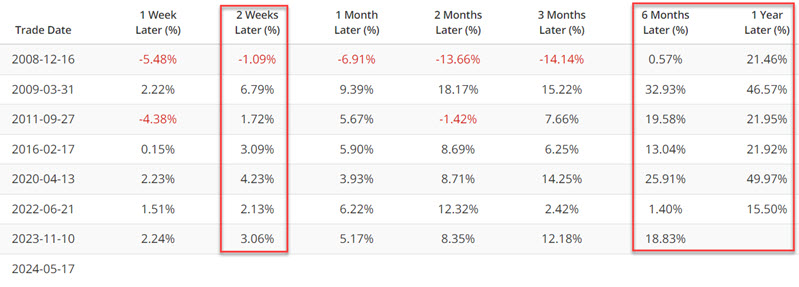
The table below displays the S&P 500 performance following each highlighted signal.
A bounce from oversold triggers a favorable signal from the S&P 1500
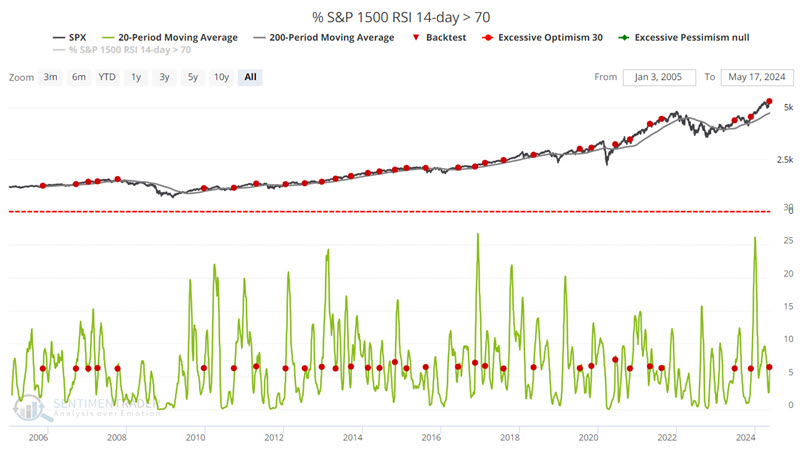
In a true bull market, an extended bullish run can follow even a brief oversold period. The chart below highlights with a red dot those dates when the 20-day moving average of the S&P 1500 % of stocks with a 14-day RSI above 70% crossed above 6.2 - while the S&P 500 was above its 200-day moving average - for the first time in three months. In other words, this indicator waits for the 20-day average of broad market breadth to drop to a very low level (i.e., below 6.2%) and then reverse higher (i.e., back above 6.2%) to signal the resumption of a favorable trend. By design, it tends to be late (i.e., after the resumption of an uptrend), but the rallies they signal tend to persist, as highlighted in the performance figures below. The most recent signal occurred on 2024-05-16.
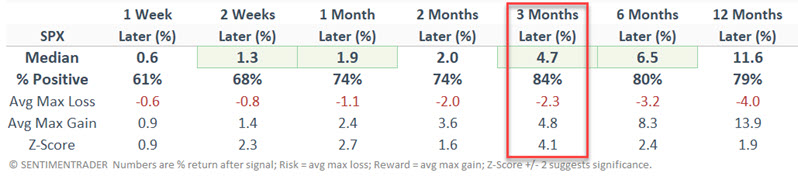
The table below summarizes S&P 500 performance following the signals in the chart above.
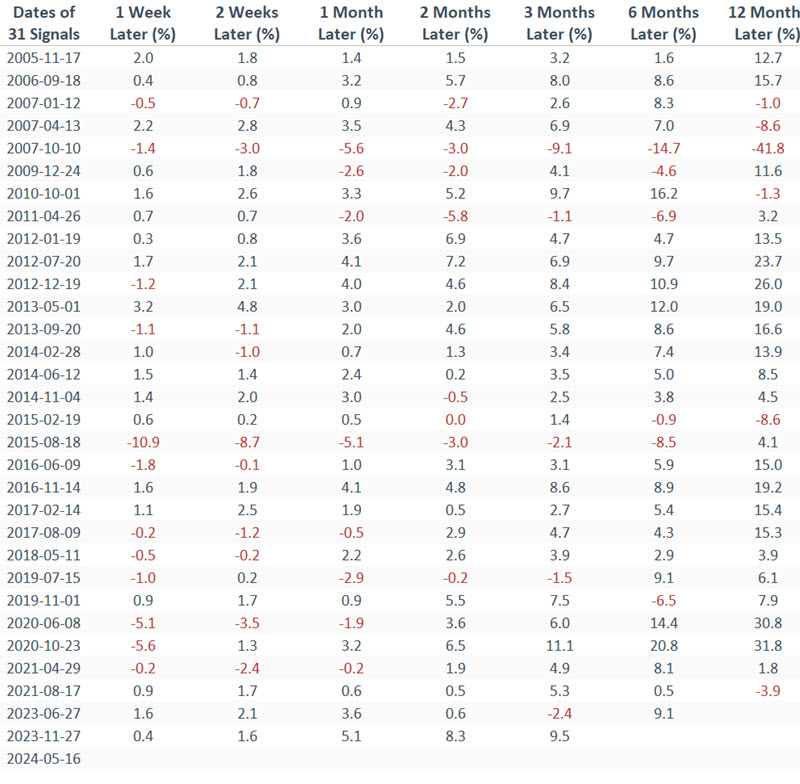
The table below displays the S&P 500 performance following each highlighted signal.
What the research tells us…
As with most indicators, there is nothing magic about any given signal. Likewise, the signals highlighted above should not be considered "trading systems" - i.e., every red dot is an automatic buy signal. However, as part of a weight of the evidence approach, their signals can generate important - and typically reliable - information. If history proves an accurate guide, the recent signals highlighted above strongly suggest that investors continue to give the bullish case for the U.S. stock market the benefit of the doubt.