
Semis have soared; is it too late to board?

Key Points
- Semiconductor stocks have soared in the last year, and investors seem to remain wary of chasing the rally
- Trader sentiment for semiconductor stocks has recently reversed from a low level and then spiked higher
- As a good market bellwether, semis often respond to favorable signals from broader market indicators
Semis have soared; is it too late to board?
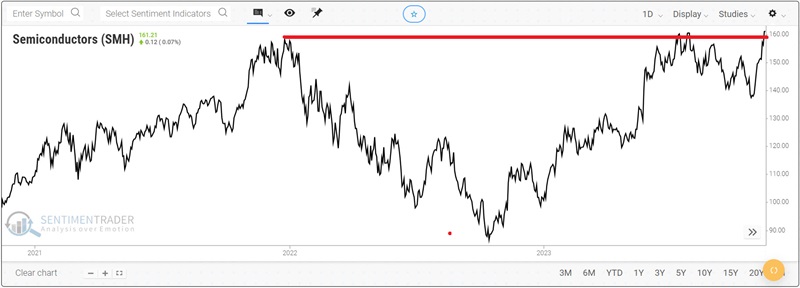
The chart below displays price action for the VanEck Semiconductor ETF (ticker SMH). This ETF has soared 93% since bottoming in October 2022 and just popped to a new all-time high.
Is it too late to climb on board? A lot of people seem to think so. In addition, human nature gives most people an aversion to climbing aboard something that has already staged such a massive advance. That said, this may be a good time to invoke:
Jay's Trading Maxim #306: Human nature can be a detriment to investment success and should be avoided as much as humanly possible.
The reality is that SMH can be highly volatile, and bear markets can witness harrowing declines that few investors can endure (-84% in 2000-2002, -74% in 2008-2009, and -48% in 2022). So, the question is, "Is it too late to jump into this turbo-charged market bellwether?"
Let's assess some relevant indicators that have addressed this topic recently.
SMH Optix has reversed from a low level…
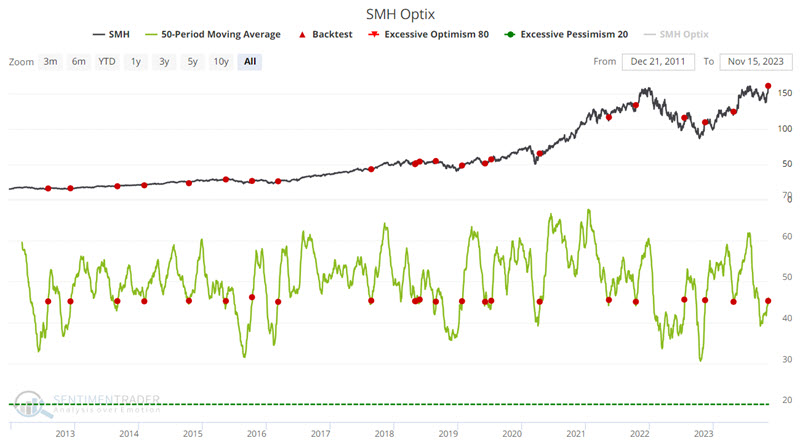
Like the ETF itself, trader sentiment regarding SMH swings widely from high to low and back again. The chart below highlights all days when the 50-day average for SMH Optix crossed above 45%. The most recent signal occurred on 2023-11-14.
The table below summarizes subsequent SMH performance.
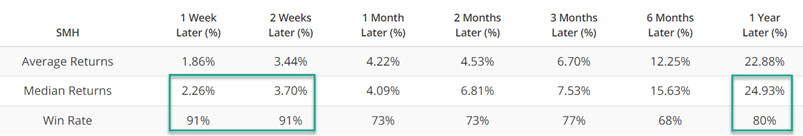
The most interesting thing to note is the tendency for SMH to perform well in the short run (91% Win Rate for 1 and 2 weeks). With a breakout to a new all-time high and some favorable holiday and 4th quarter seasonal factors also in play, this seems like fertile ground for aggressive short-term traders.
…then Optix spiked higher
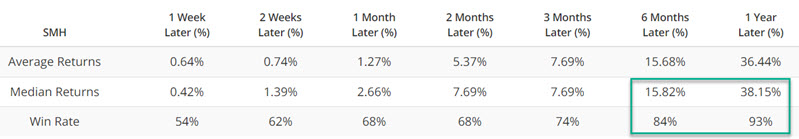
Another take on SMH Optix is highlighted in the chart below. It shows all dates when the 3-day average for SMH Optix crossed above 80% while SMH was also above its 200-day moving average. The most recent signal occurred on 2023-11-14.
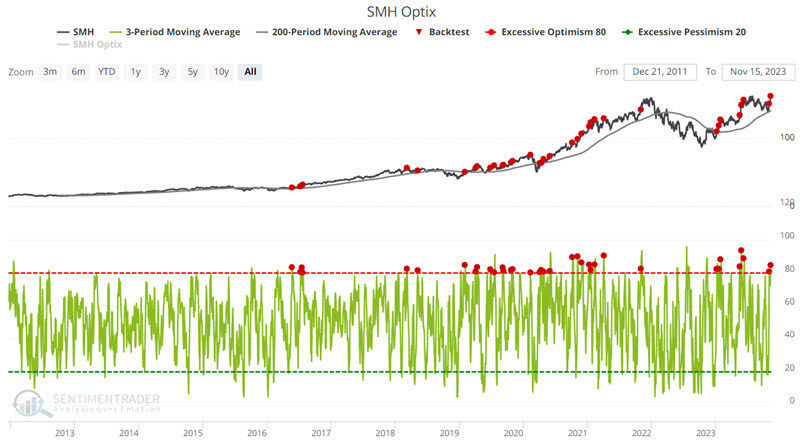
The table below summarizes subsequent SMH performance. Note that the 12-month results are excellent overall. However, the reality of trading requires us to note that following the 2021-11-03 signal, SMH suffered a brutal -35.28% decline. The bottom line: These results suggest a favorable tilt for SMH moving forward, BUT traders must pay close attention to price action and make contingency plans to cut a loss if the latest signal does not pan out. The latest signal here is an indication that leans favorable, NOT an automatic "buy signal."
A Risk On indicator bodes well for semis
The semiconductor industry has long tended to be a valuable bellwether for the overall stock market (i.e., when the semiconductor sector is performing well, typically, so too is the overall stock market, and vice versa). As a result, indicators that work well for the broader market also tend to see outstanding results when applied to the semiconductor sector.
The S&P High Beta / S&P High Quality Relative Ratio Rank indicator often highlights when investor sentiment moves from a risk-off mentality to a risk-on mindset. The chart below highlights those times when the 20-day average for this indicator crossed above 7.5 (suggesting a reversal from risk off to risk on behavior), and the table summarizes SMH performance. The most recent signal occurred on 2023-11-15.
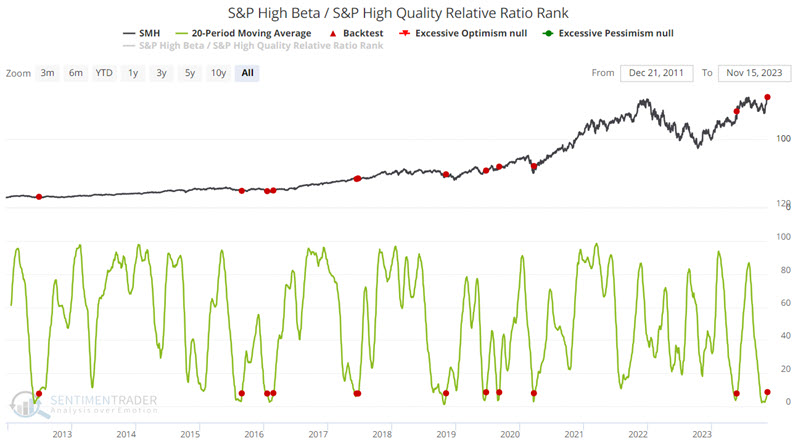
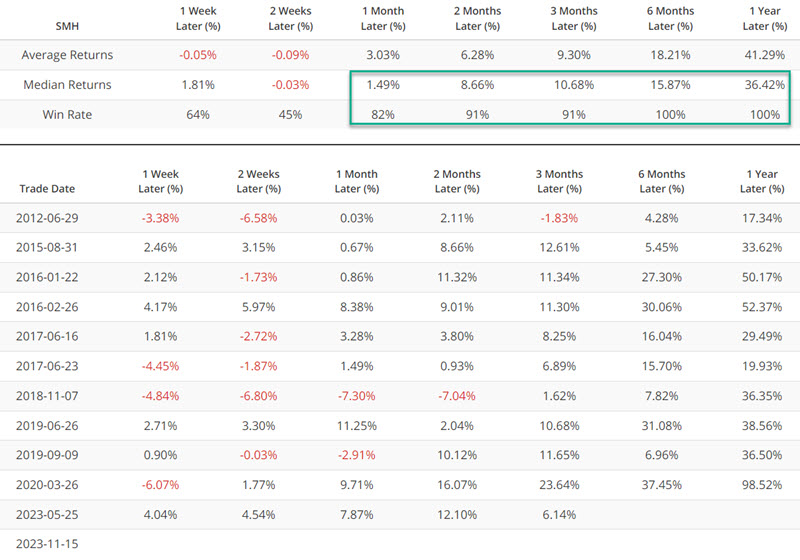
The good news is that the results have been highly favorable. The potential bad news is that data for this indicator only goes back to 2011, so it represents a relatively short test period (and one that saw a lot of favorable action for SMH). As a result, the most recent signal should not be viewed as an automatic buy signal for SMH but rather as another weight of the evidence piece of the puzzle.
Breadth thrusts tend to foreshadow higher semiconductor stock prices
The overall market has experienced a significant breadth thrust in the last week. This tends to bode well for bellwether sectors such as semiconductors. The chart below highlights those rare occasions when the % S&P 1500 RSI 2-day < 30 indicator is below 2% for the first time in 12 months. The most recent signal occurred on 2023-11-14.
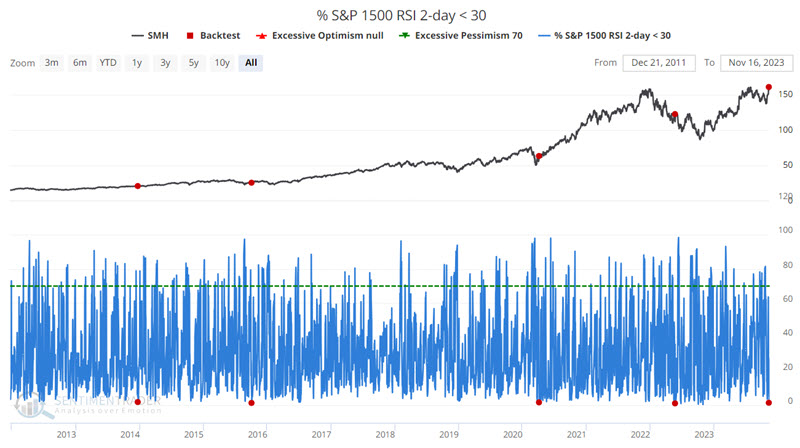
The test period is relatively short, and the sample size is small, so results must be considered in that context. Nevertheless, this is a signal that simply does not happen often. Twelve-month results so far have been terrific. However, SMH plunged over -30% from the 2022-05-27 signal to the ultimate low in October 2022. So once again, the latest signal from this indicator should be viewed as the weight of the evidence and not necessarily as some "sure thing" (which it is not).
The Panic/Euphoria Model suggests there may still be significant upside potential
Pessimism and distrust of the market have remained high throughout 2023. The chorus of "it's only seven stocks holding up the market" has invaded many investors' psyches and has them waiting for the inevitable "other shoe to drop." But our Panic/Euphoria Model suggests that the majority may have it wrong.
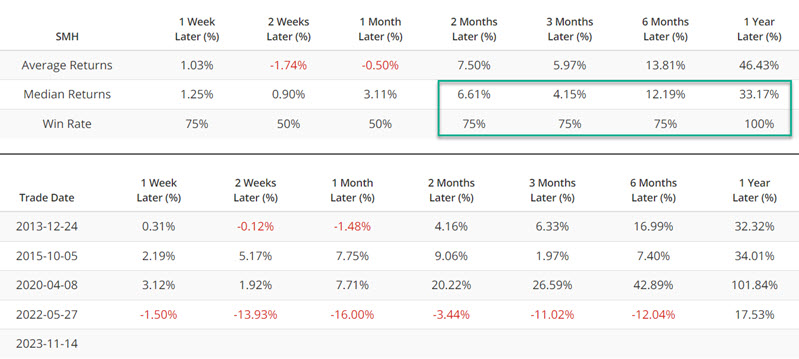
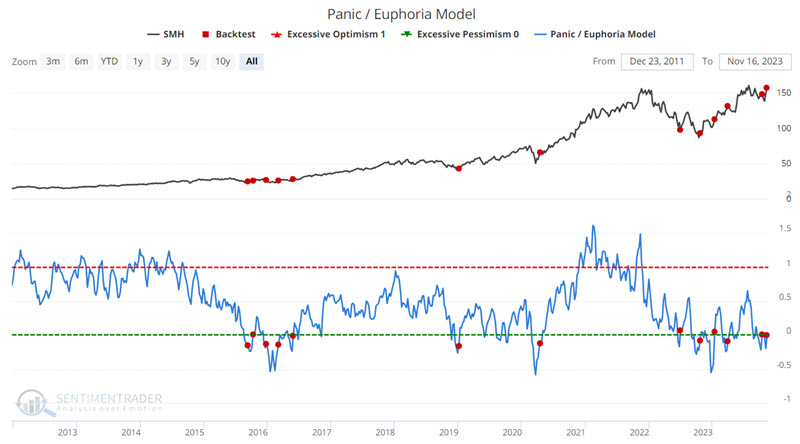
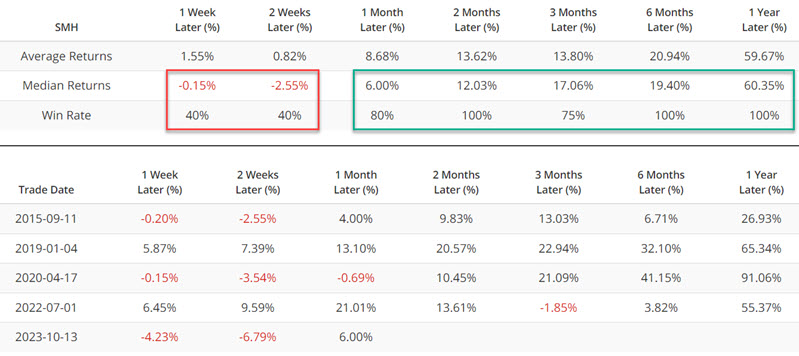
The chart and table below highlight all dates when the Panic/Euphoria Model crossed above -0.168. The most recent signal occurred on 2023-11-10.
The caveat of a relatively short test also applies here. That said, it is hard to ignore the robust six and twelve-month returns following previous signals. While investors should not get dollar signs in their eyes (and a stop-loss contingency is essential to limit risk), this indicator clearly argues for giving the bullish case the benefit of the doubt unless and until price action argues otherwise.
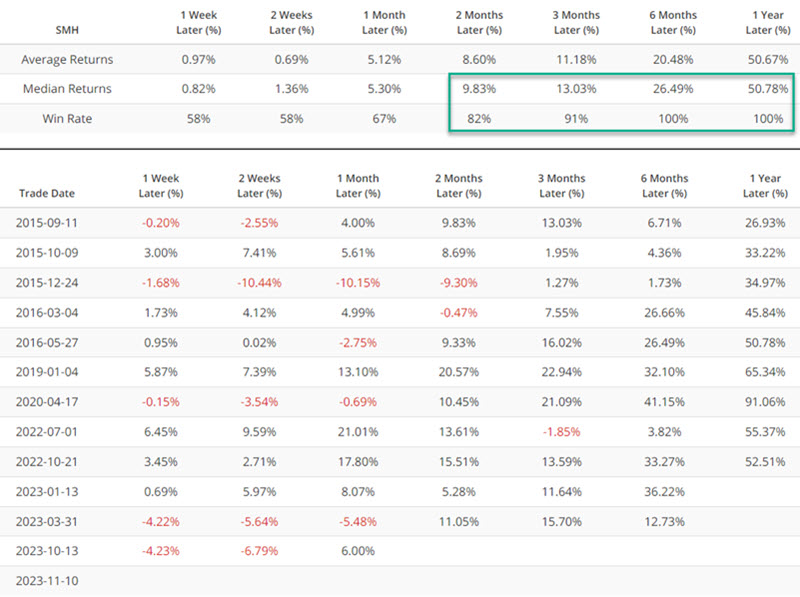
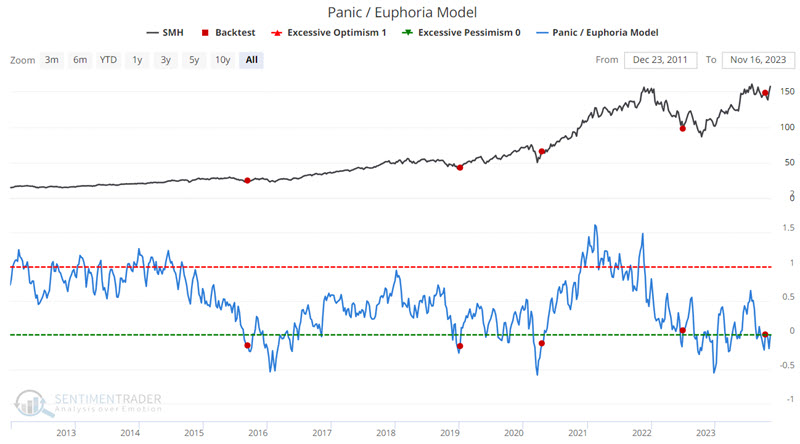
Lastly, if we limit the signals above to one every twelve months (the most recent signal then occurred on 2023-10-13), the results are pretty compelling.
What the research tells us…
The weight of the evidence appears to be lining up as favorable for the semiconductor sector. If the history of the indicators above proves an accurate guide, ticker SMH could/should/might soar sharply higher over the next twelve months. Alas, there is no way to know that history will be on the investor's side this time. As always, the proper approach for a trader or investor who finds the case for SMH compelling is to carefully consider how much capital to reasonably allocate and how to manage risk if things do not pan out as hoped.
Same as it ever was.