
Semiconductors flash a buy signal

Key points #1:
- The spread between the 5 and 20-day average true range indicator cycled from high to low
- At the same time, market momentum for the semiconductor ETF turned positive
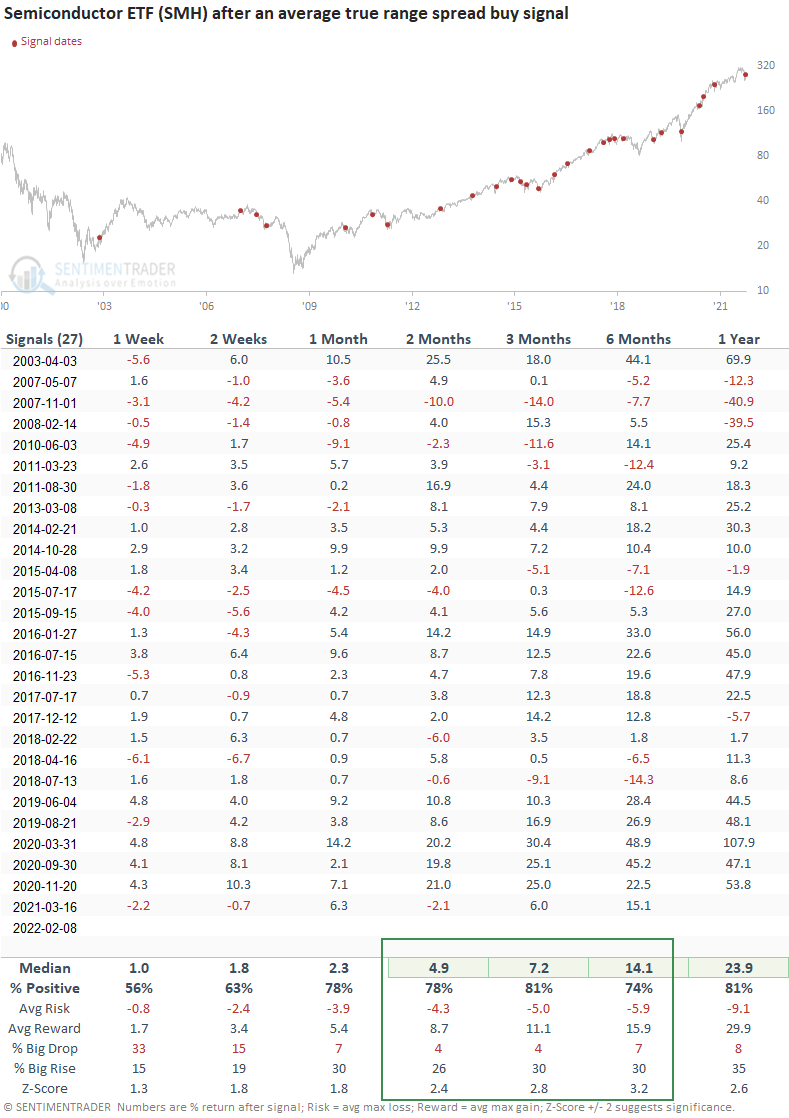
- Semiconductors have rallied 81% of the time after other signals
Key points #2:
- The value traded ratio between levered long and short semiconductor ETFs cycled from high to low
- At the same time, market momentum for the semiconductor ETF turned positive
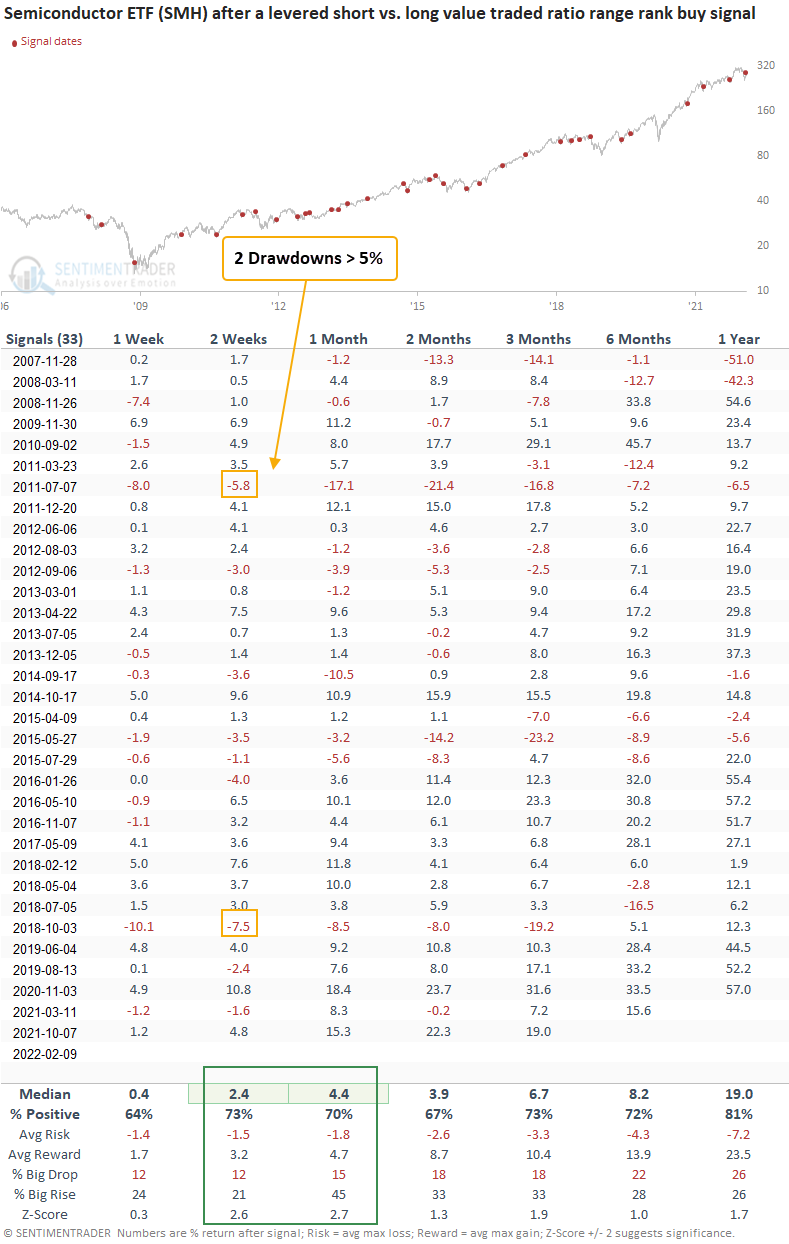
- Semiconductors have rallied 73% of the time after other signals
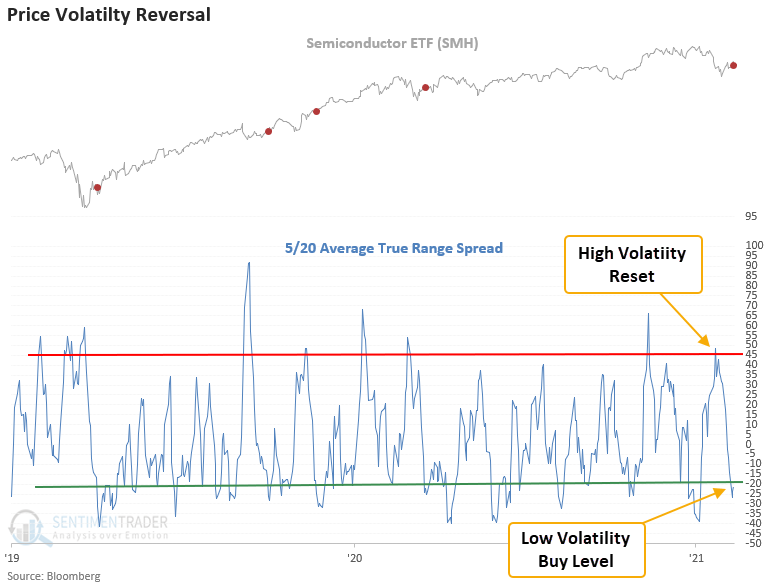
Using the average true range indicator to identify price volatility reversals
A trading model that uses the average true range indicator to identify when price volatility cycles from high to low issued a buy signal for the semiconductor industry at the close of trading on 2/8/22.
Please click here and here to read the original ATR concept notes.
Semiconductor stocks rallied 81% of the time after other signals
This signal has triggered 27 other times over the past 19 years. After the others, semiconductor future returns, win rates, and risk/reward profiles were excellent across all time frames. The 2-month window shows only 2 drawdowns greater than 5%. Suppose I run an optimization to identify the best days-in-trade holding period. In that case, it returns 36 days with a 92% win rate.
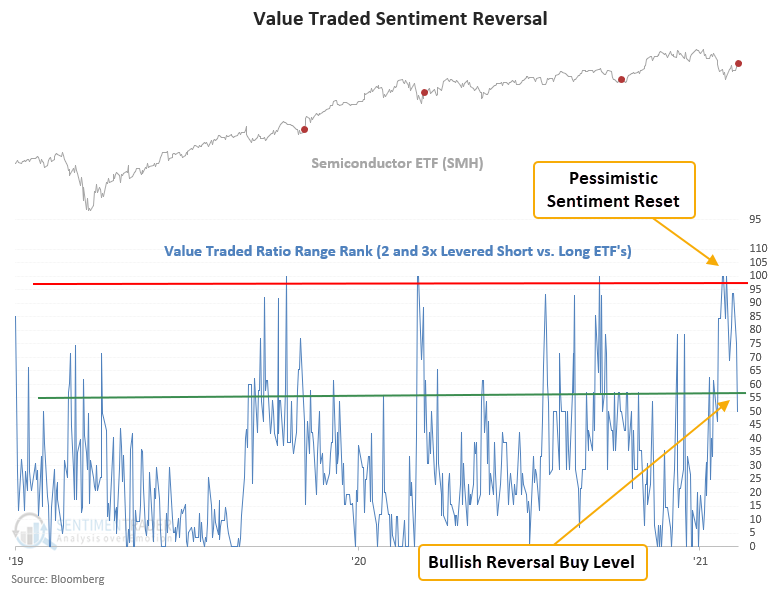
Using long and short ETFs to identify sentiment reversals
A trading model that uses ETFs to identify when bearish bets relative to bullish bets reverse from an elevated level issued a buy signal for the semiconductor industry at the close of trading on 2/9/22.
The model applies an 84-day range rank to the value traded ratio between 2 and 3x levered short versus long semiconductor ETFs. As a reminder, the range rank indicator measures the current value relative to all other values over a lookback period. 100 is the highest, and 0 is the lowest. The pessimistic reset condition occurs when the range rank crosses above the 99th percentile. A new buy signal triggers when the range rank crosses back above the 56th percentile. Within five days of the cross, the 1 & 5-day rate of change for the SMH ETF must be >= 0%. i.e., market momentum is positive.
Semiconductor stocks rallied 73% of the time after other signals
This signal has triggered 33 other times over the past 15 years. After the others, semiconductor future returns and win rates profiles were solid across almost all time frames. The 2 and 4-week windows stand out with significant z-scores, and the former shows only 2 drawdowns greater than 5%.
 What the research tells us...
When the average true range spread cycles from a high volatility regime to a low volatility regime, it signals that investors have started to calm down after a panic, or at least heightened concern. Similar setups to what we're seeing now have preceded rising semiconductors prices, especially on a medium-term basis.
When the value traded ratio range reverses from an elevated level, bearish bets decline relative to bullish bets. Similar setups to what we're seeing now have preceded rising semiconductors prices, especially in the near term.