Data &
Technology
Research
Reports
Report Solutions
Reports Library
Actionable
Strategies
Free
Resources
Simple Backtest Calculator
Simple Seasonality Calculator
The Kelly Criterion Calculator
Sentiment Geo Map
Public Research Reports
Free Webinar
Pricing
Company
About
Meet Our Team
In the News
Testimonials
Client Success Stories
Contact
Log inLoginSign up
< BACK TO ALL REPORTS

Selling in Hong Kong Nears Panic Proportions

Jason Goepfert
2021-09-23
The Hang Seng index has suffered a historic level of internal panic selling among its stocks.

Fear that debt troubles with China's Evergrande would spread globally was the most common excuse for Monday's slide. Using it as a reason for drops in the U.S. is questionable, but the closer you get geographically, the more sense it makes.

Stocks in Hong Kong certainly have been feeling that pressure, thanks in part to a plunge in property developers and related companies.

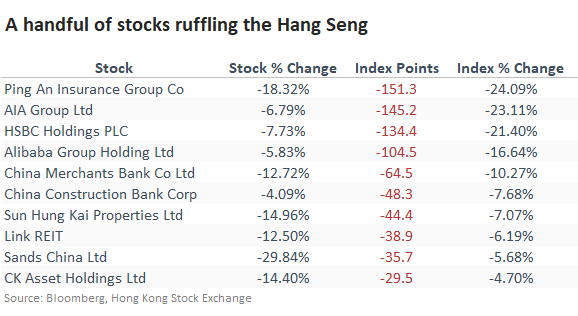
According to Bloomberg calculations, the five stocks with the most significant losses accounted for 600 of the Hang Seng's 628-point loss over the past month.

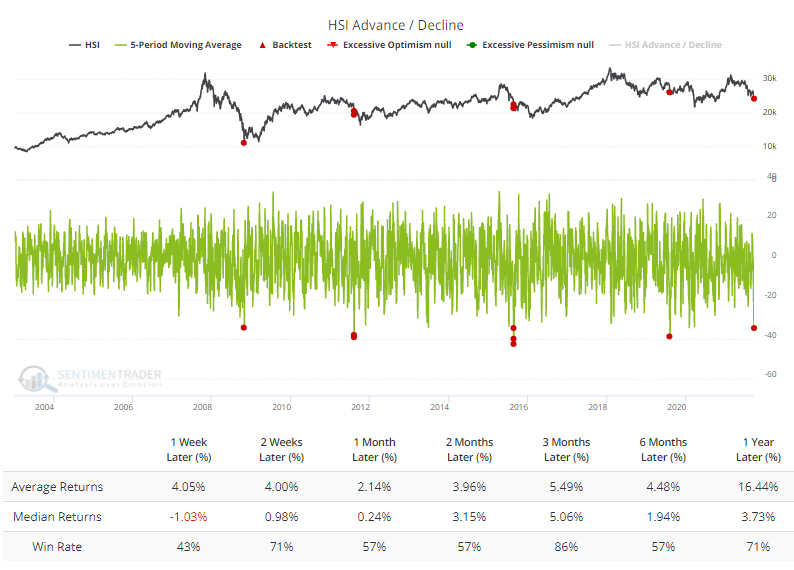
Over 5 days into Monday, an average of more than 34 stocks in the index declined versus advanced, one of the most extreme readings in nearly 20 years. The Backtest Engine shows mostly positive returns after the others. The index continued to slide for a couple more months in August 2011, then reversed those losses in the months ahead.

hang seng index advance decline

In prior years, we've looked at a breadth composite when a particular market looks like it's suffering panic-level selling pressure (like Mexico and South Korea in 2019). This composite includes breadth metrics that have a good record at highlighting overwhelming internal selling pressure.

When we look at that composite for the Hang Seng, we can see that it is nearing panic-level conditions that have indicated washout selling pressure over the past 20 years.


What else we're looking at

  • Full returns in the Hang Seng following panic-level aggregate breadth readings
  • What happens after an extended run of bullish sentiment finally ends
  • Updating a seasonal tendency in gold stocks

Stat box

More than 85% of NYSE volume flowed into advancing stocks on Wednesday. That's the 15th-highest amount since 1996 on a day when the FOMC announced its decision and outlook on interest rates.

Etcetera

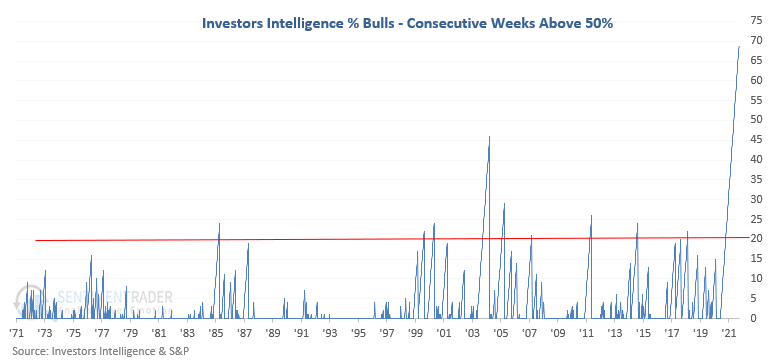
What a run. This week, fewer than 50% of newsletter writers expect stocks to rise. Finally. Dean noted that it had been 69 weeks - almost a year and a half - since the last time that Investor's Intelligence reported a non-majority of bulls.

newsletter bulls above 50%

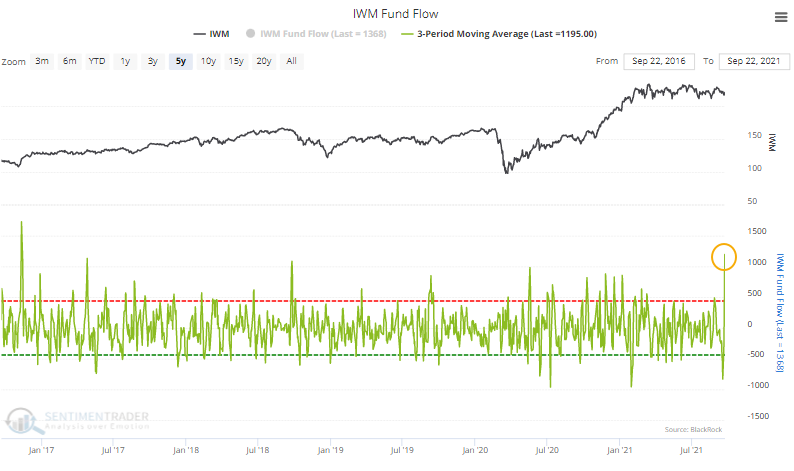
Big shift in small stocks. After days of pulling money out of the IWM small-cap ETF, traders returned in force. The fund pulled in an average of nearly $1.2 billion over the past three days, nearly the most in 5 years. 

iwm small cap fund flow

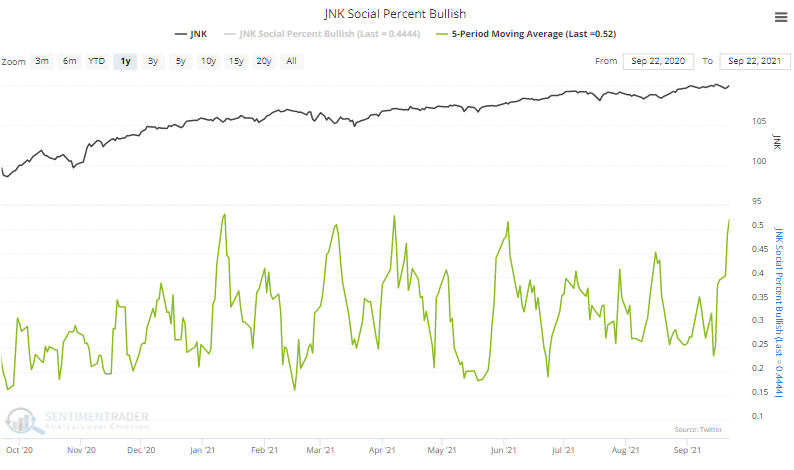
Bullish on junk. On social media, more than 50% of messages have been bullish on the JNK high-yield bond fund during the past week. That's nearing the highest percentage of the past year.

jnk twitter social media sentiment

DATA &
TECHnologies
IndicatorEdge
‍
BackTestEdge
‍
Other Tools
‍
DataEdge API
RESEARCH
reports
Research Solution
‍
Reports Library
‍
actionable
Strategies
Trading Strategies
‍
Smart Stock Scanner
‍
FREE
RESOUrCES
Simple Backtest
Calculator
Simple Seasonality
Calculator
The Kelly Criterion
Calculator
Sentiment Geo Map
‍
Public Research Reports
‍
Free Webinar
COMPANY
‍
About
‍
Meet our Team
‍
In the News
‍
Testimonials
‍
Client Success Stories
Pricing
Bundle pricing
‍
Announcements
‍
FAQ
© 2024 Sundial Capital Research Inc. All rights reserved.
Setsail Marketing
TermsPrivacyAffiliate Program
Risk Disclosure: Futures and forex trading contains substantial risk and is not for every investor. An investor could potentially lose all or more than the initial investment. Risk capital is money that can be lost without jeopardizing ones’ financial security or life style. Only risk capital should be used for trading and only those with sufficient risk capital should consider trading. Past performance is not necessarily indicative of future results.

Hypothetical Performance Disclosure: Hypothetical performance results have many inherent limitations, some of which are described below. No representation is being made that any account will or is likely to achieve profits or losses similar to those shown; in fact, there are frequently sharp differences between hypothetical performance results and the actual results subsequently achieved by any particular trading program. One of the limitations of hypothetical performance results is that they are generally prepared with the benefit of hindsight. In addition, hypothetical trading does not involve financial risk, and no hypothetical trading record can completely account for the impact of financial risk of actual trading. for example, the ability to withstand losses or to adhere to a particular trading program in spite of trading losses are material points which can also adversely affect actual trading results. There are numerous other factors related to the markets in general or to the implementation of any specific trading program which cannot be fully accounted for in the preparation of hypothetical performance results and all which can adversely affect trading results.

Testimonial Disclosure: Testimonials appearing on this website may not be representative of other clients or customers and is not a guarantee of future performance or success.