
Seeking Health Care - Part II

Key Points
- Part I detailed developments in seasonality and sentiment regarding the health care sector
- Insider buying in the health care sector has picked up slightly in recent weeks…
- …meanwhile, insider selling in the health care sector has taken a sharp dive
- The tradeoff between the two has reached an extreme level that has generally favored the bulls going forward
- Breadth among health care stocks has recently bounced off of an oversold level
Insider Activity
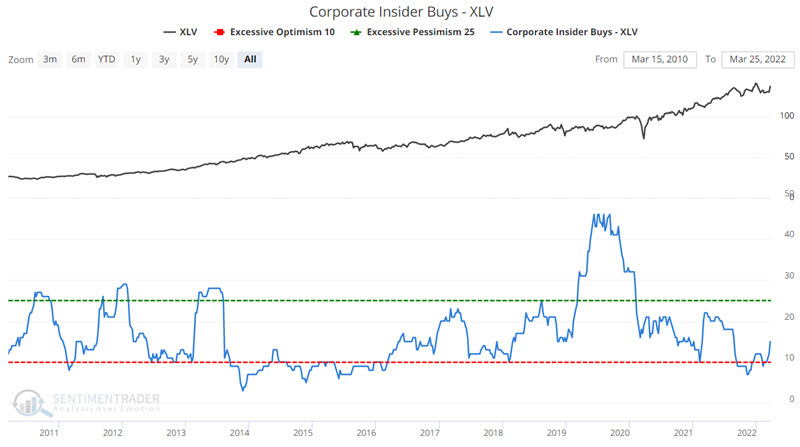
Let's look at the buying and selling of their stock by corporate insiders (executives and directors) of companies held by XLV. The chart below tracks the buying activity. While recently improved, the level of buying is only moderate, not overwhelming.
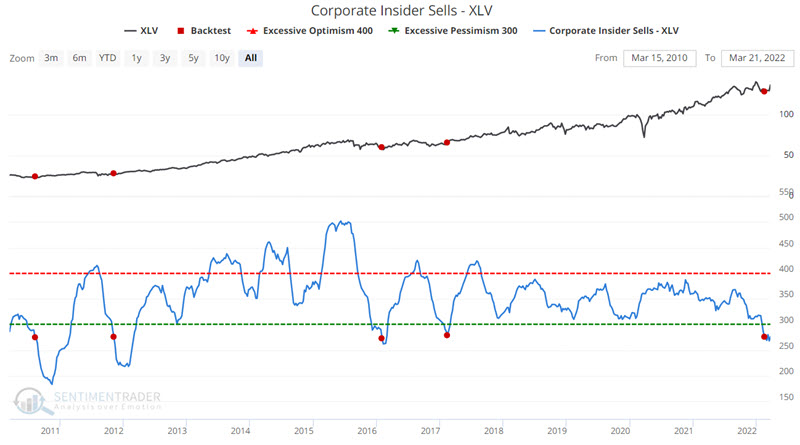
The interesting twist is that while buying is not "off the charts" - as we just saw above - insider selling has declined to a significantly low level. The chart below tracks the selling activity for health care insiders. The red dots highlight those rare occasions when the value for this indicator crossed below 280, i.e., when insider selling starts to seriously "dry up." You can run this test in the Backtest Engine.
The table below displays XLV performance following previous drops in the Corporate Insider Sells - XLV indicator below 280. 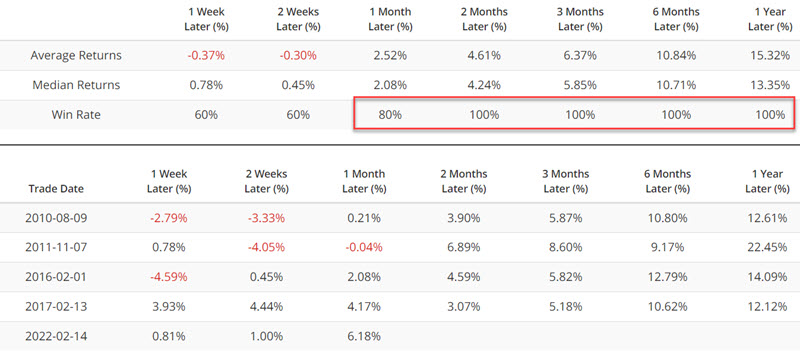
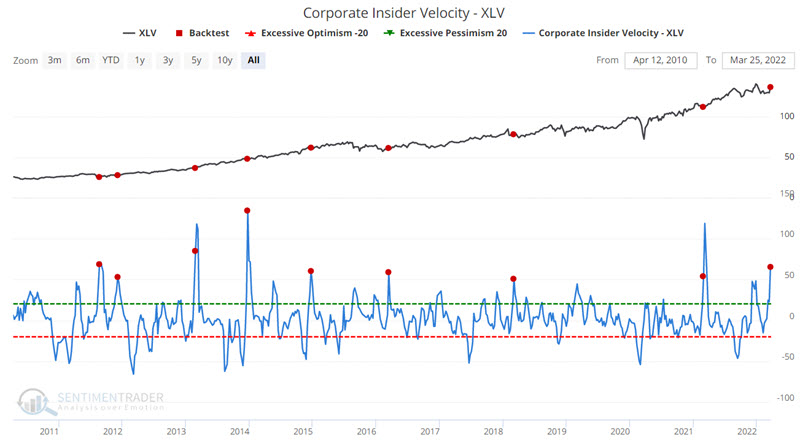
The drying up of selling has dramatically affected the Corporate Insiders Velocity - XLV indicator. This indicator shows the velocity of corporate insider buying versus selling in XLV ETF (health care) stocks. It takes a 4-week rate of change for insider buys and subtracts a 4-week rate of change for insider sales. The more positive the difference, the more favorable the view among insiders, and the more positive the outlook for stocks in the sector. The lower the difference, the more unfavorable the view among insiders, and the worse the outlook for stocks in the sector.
The chart below highlights those times when the Buy/Sell Velocity for XLV crossed above 50. You can run this test in the Backtest Engine.
The table below displays a summary of XLV performance following previous signals.
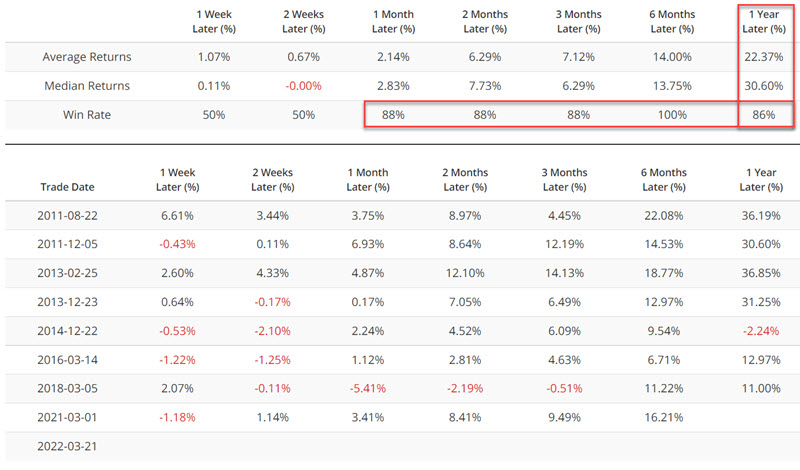
The results for the insider buying indicators look pretty favorable. Please note that our corporate insider buying and selling database only goes back to 2010. The 2010-2022 period has been biased to the upside for stocks, so results should be viewed in that context. As always, confirmation from other indicators is essential.
Breadth
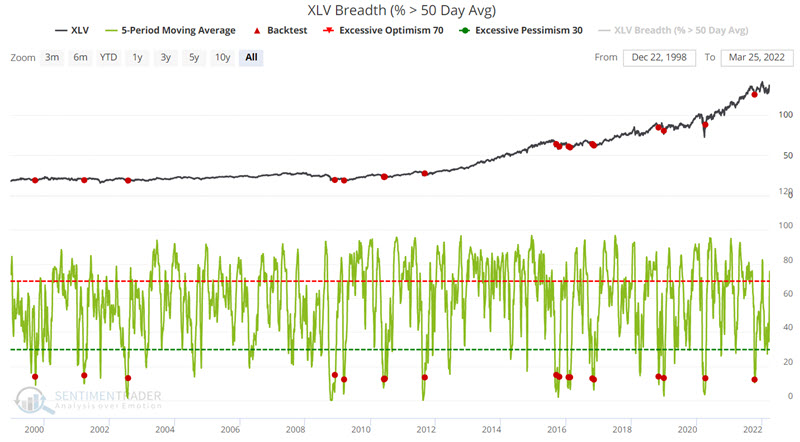
Another indicator area to consider is breadth. The chart below displays when the 5-day average of XLV Breath (% > 50-day average) crossed above 12. You can run this test in the Backtest Engine.
The table below displays a summary of XLV performance following previous signals.
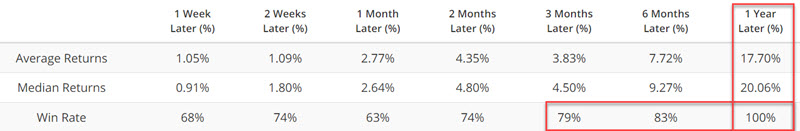
The most recent signal occurred on 10/21/2021. Through the first three months after that signal, XLV rose +8.18%. Interestingly, following the previous 18 signals, XLV moved higher 16 times (or 89% of the time) from three months after the signal to twelve months after the signal. In other words, it is not unreasonable to believe that there may be more upside available in the months ahead.
What the research tells us...
In Part I, we looked at favorable developments regarding seasonality and sentiment for the health care sector. We focused on favorable corporate insider trading and sector breadth developments in Part II. The bad news is that no amount of favorable indicators ever "guarantees" a specific outcome in the stock market. The good news is that for investors willing to assume reasonable risks, the health care sector presently has several historically favorable factors seeming to work in its favor in the months ahead.