Products
SentimenTrader Trading Tools
‍
Backtest Engine
My Trading Toolkit
Correlation Analysis
Seasonality
Market Prediction
Indicators & Data API
‍
Proprietary Indicators & Charts
Market Data API
Strategies & Scanner
‍
50+ Trading Strategies
Smart Stock Scanner
Smart Option Scanner
Research Reports
‍
Research Solutions
Reports Library
Free Resources
Simple Backtest Calculator
Simple Seasonality Calculator
The Kelly Criterion Calculator
Sentiment Geo Map
Public Research Reports
Education
Sentiment Indicators
Technical Indicators
Pricing
Company
About
In the News
Testimonials
Client Success Stories
Contact
Log inLoginSign up
< BACK TO ALL REPORTS

Seeking Health Care - Part I

Jay Kaeppel
2022-03-28
Several key factors - including seasonality, sentiment, insider activity, and breadth appear to be lining up on the favorable side of the ledger for the health care sector. In Part I, we detail the latest developments regarding seasonality and sentiment.

Key Points

  • The health care sector pulled back roughly 12% during the January-February sell-off before rebounding nicely in March
  • Presently seasonality, sentiment, insider activity, and even breadth appear to be lining up on the favorable side of the ledger
  • Ticker XLV allows traders to play the broader health care sector

Seasonality I

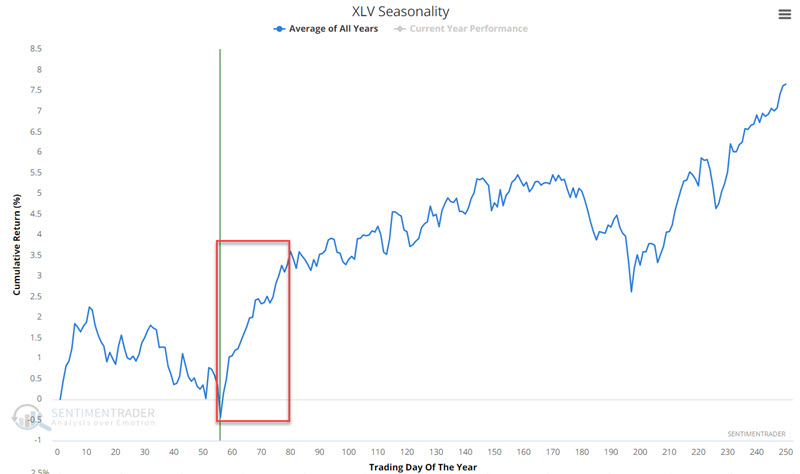
The chart below displays the annual seasonal trend for XLV (Health Care Select Sector SPDR ETF). A favorable seasonal period extends from Trading Day of the Year (TDY) #56 through TDY #80. For 2022, this period extends from 3/23 through 4/27.

We will use a health care sector daily data series for our next test that goes back to 1954. The index uses the Fama French data series from 1954 into 1990 and S&P 500 health care sector from there.

The chart below displays the growth of $1 invested in the health care sector data series described above ONLY during this favorable period since 1954.

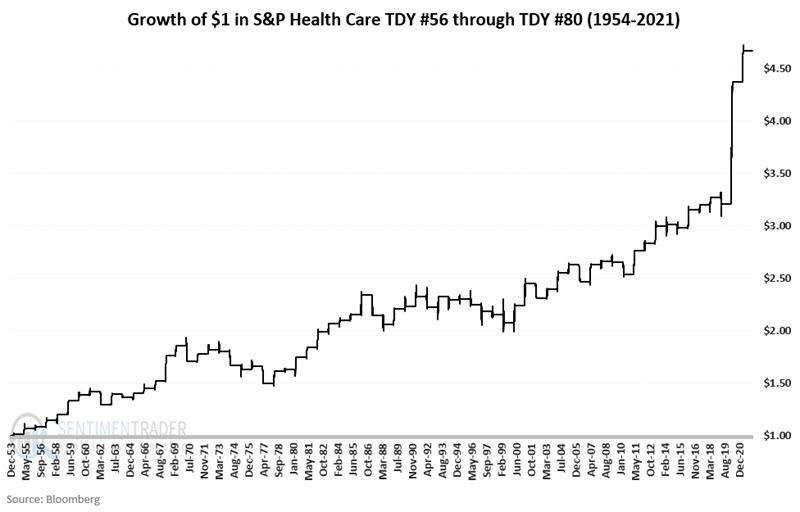
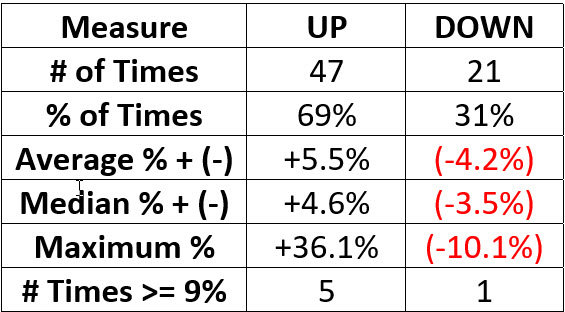
The table below displays a summary of performance results.

Seasonality II

Using month-end closing price data, let's consider a larger seasonal perspective on the health care sector, going back to 1927.

The chart below displays the growth of $1 invested in our health care sector data series ONLY during March through August every year starting in 1927.

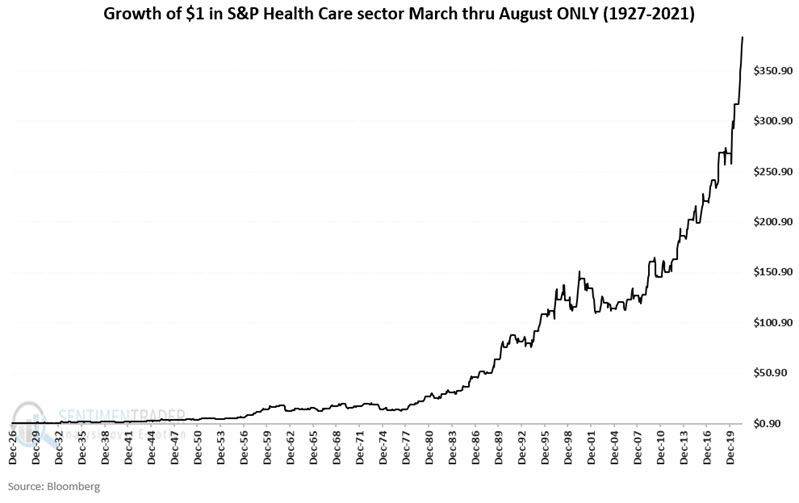
The chart below displays the same results on a logarithmic scale.

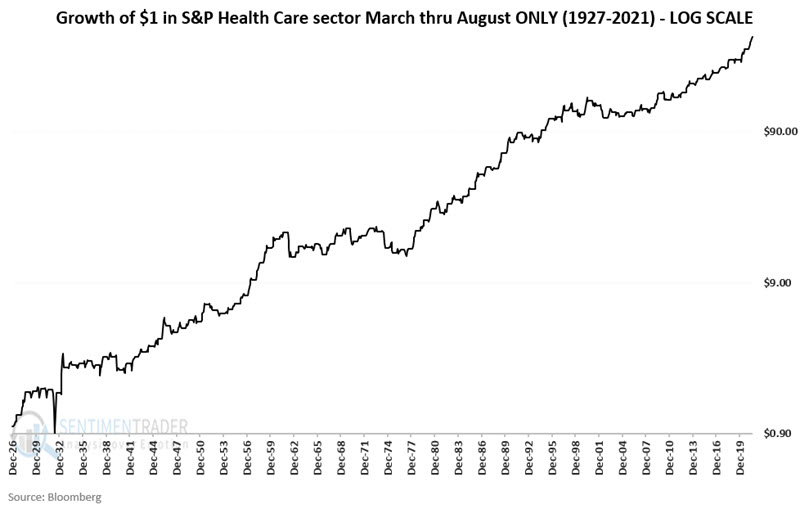
The table below displays a summary of performance.

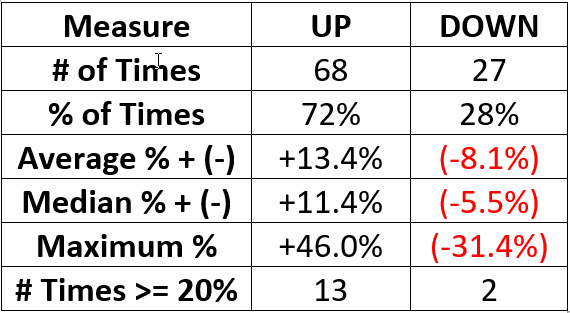
Seasonality suggests a potentially favorable environment for the health care sector in the weeks and months ahead. However, Win Rates of 69% and 72% remind us that there are no "sure things" and that intelligent capital allocation and risk management remain equally important parts of the investing equation.

Now let's turn our attention to sentiment.

Sentiment

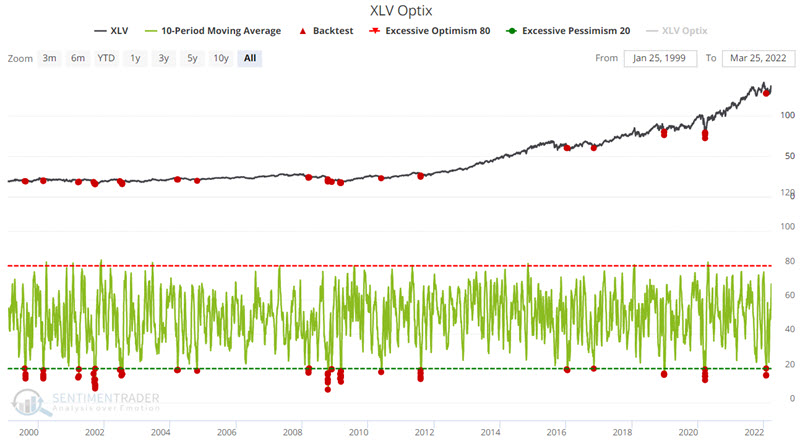
The chart below displays all days when the 10-day moving average for XLV Optix was below 20. You can run this test in the Backtest Engine.

The table below displays a summary of the results.

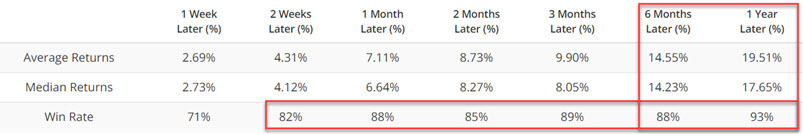
The table below displays the dates of the most recent signals and the results so far.

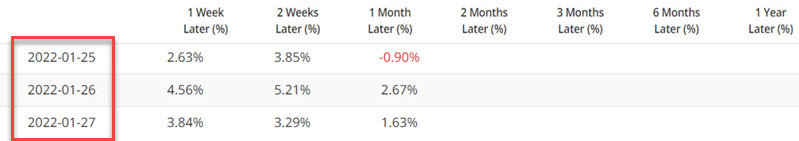
Sentiment also suggests a potentially favorable environment for the health care sector in the months ahead.

What the research tells us...

Both seasonality and sentiment presently appear to be favorable factors for the health care sector. In Part II, we will look at corporate insider buying and selling in the health care sector and sector breadth.

PRODUCTS
SentimenTrader
Trading Tools
Indicators & Data API
‍
Strategies & Scanner
‍
Research Reports
FREE
RESOUrCES
Simple Backtest
Calculator
Simple Seasonality
Calculator
The Kelly Criterion
Calculator
Sentiment Geo Map
‍
Public Research Reports
‍
Education
Sentiment Indicators
‍
Technical Indicators
‍
Pricing
Bundle pricing
‍
FAQ
‍
Announcements
‍
COMPANY
‍
About
‍
In the News
‍
Testimonials
‍
Client Success Stories
CONTACT
‍
General Inquiries
‍
Media Inquiries
‍
Financial Professionals Inquiries
‍
© 2026 Sundial Capital Research Inc. All rights reserved.
Setsail Marketing
TermsPrivacyAffiliate Program
Risk Disclosure: The information and tools provided are for research and analytical purposes only and are not intended as investment advice. Market analysis involves uncertainty, and outcomes may differ from expectations. Users should conduct their own due diligence and consider their individual circumstances before making any financial decisions. Past performance is not necessarily indicative of future results.

Hypothetical Performance Disclosure: Hypothetical performance results have many inherent limitations, some of which are described below. No representation is being made that any account will or is likely to achieve profits or losses similar to those shown; in fact, there are frequently sharp differences between hypothetical performance results and the actual results subsequently achieved by any particular trading program. One of the limitations of hypothetical performance results is that they are generally prepared with the benefit of hindsight. In addition, hypothetical trading does not involve financial risk, and no hypothetical trading record can completely account for the impact of financial risk of actual trading. for example, the ability to withstand losses or to adhere to a particular trading program in spite of trading losses are material points which can also adversely affect actual trading results. There are numerous other factors related to the markets in general or to the implementation of any specific trading program which cannot be fully accounted for in the preparation of hypothetical performance results and all which can adversely affect trading results.

Testimonial Disclosure: Testimonials appearing on this website may not be representative of other clients or customers and is not a guarantee of future performance or success.