
Sectors versus leading economic indicators

Key points
- It should surprise no one that stocks tend to perform better during a good economy than a bad one
- In a recent piece, we highlighted one indicator for gauging economic activity based on movements in the Conference Board's Index of Leading Economic Indicators
- The last piece highlighted the real estate sector (for reasons detailed below); this piece looks at all sector performance based on the status of our LEISum indicator
Stocks thrive on a growing economy
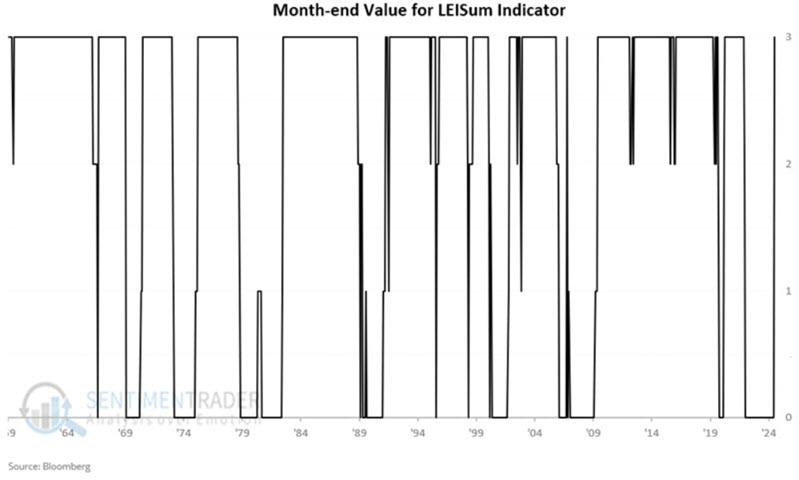
Our LEISum indicator ranks the economy's strength based on the trend in the leading economic indicators. It is updated at the end of each month and can read 0, 1, 2, or 3-with 3 being the strongest and zero the weakest. For full details on indicator calculations, please see this piece.
NOTE: The LEISum indicator is not currently available on the Sentimentrader.com website. I plan to coordinate with our programming team to have it added soon.
The chart below displays the monthly readings for our LEISum indicator starting in 1959. At the end of January 2025, the indicator returned to a reading of +3 after sitting at zero since July 2022.
For testing purposes, we use S&P 500 sector data starting in 1959 (the earliest data we have for the leading economic indicator index). The table below displays the cumulative percentage growth for each sector if held only during months when LEISum ended the previous month at a particular value.
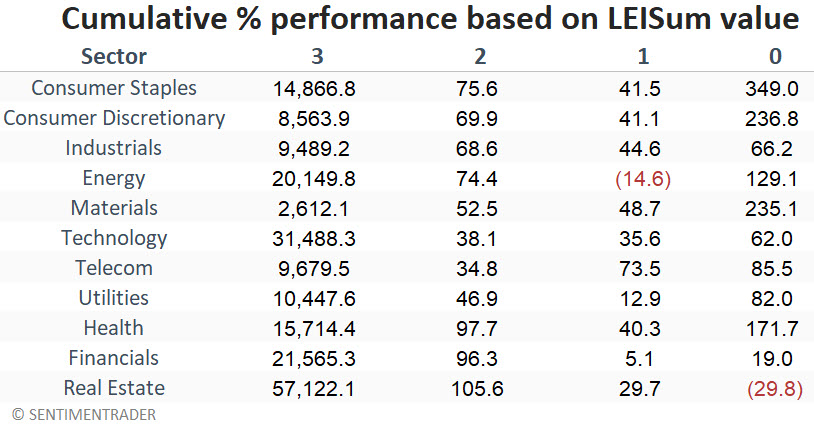
First, note that all sectors gained much more ground when LEISum was at a +3 reading than during all other combined periods. This highlights the critical influence that the economy's state has on stocks.
Second, if you want to know why the real estate sector was highlighted in the initial piece, note the difference in real estate sector performance during +3 periods versus 0 periods. During +3 periods, real estate was the performer (+57,122%) by a factor of 1.8-to-1 over the second-best performer (Technology at +31,488%) and by a factor of 2.8-to-1 over the third-best performer (Financials at +21,565%).
During 0 periods, the real estate sector was the only sector to register a net loss (-29.8%). The difference between +57,122% and -29.8% is stark and unmistakable, pointing to how inherently sensitive this sector is to economic performance.
Sector performance while LEISum = 3
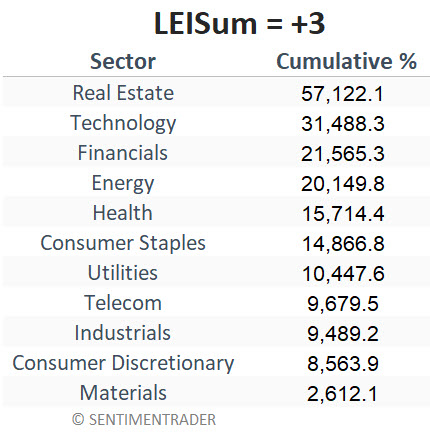
A reading of +3 means that the latest monthly reading for the leading indicators index is above its 12-month EMA, AND the six-month moving average of monthly readings is above the six-month moving average at the end of last month (i.e., the six-month MA is trending higher).
The table below ranks the sectors' cumulative performance during all +3 LEISum periods. Real estate, technology, financials, and energy have been the big winners during a growing economy. On the other hand, the defensive materials sector gained only 1/20 as much as real estate. This suggests that materials are not the place to be right now.
Sector performance while LEISum = 2
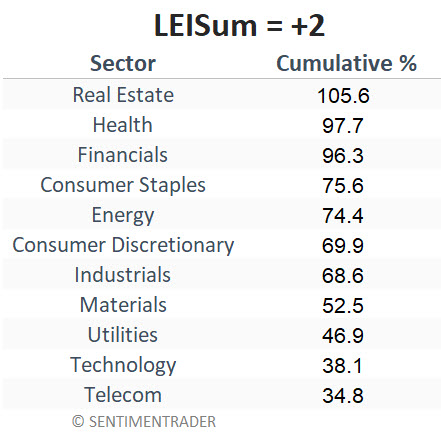
A reading of +2 means that the latest monthly reading for the leading indicators index is above its 12-month EMA, BUT the six-month moving average of monthly readings is below the six-month moving average at the end of last month (i.e., the six-month MA is trending lower).
The table below ranks the sectors by cumulative performance during all +2 LEISum periods. Real estate is once again the top performer, with healthcare and financial a close second and third. Interestingly, the technology and telecom sectors are the laggards here.
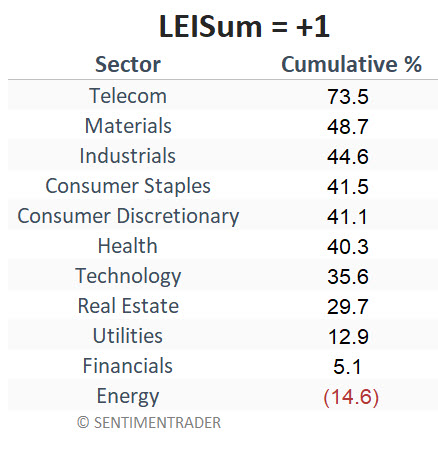
Sector performance while LEISum = 1
A reading of +1 means that the latest monthly reading for the leading indicators index is below its 12-month EMA, BUT the six-month moving average of monthly readings is above the six-month moving average at the end of last month (i.e., the six-month MA is trending higher).
The table below ranks the sectors by cumulative performance during all +1 LEISum periods. Telecom leads the pack here, with materials, industrials, consumer staples, consumer discretionary, and healthcare all in the 40% to 48% range. Energy shows a slight loss, and financials only show a meager gain.
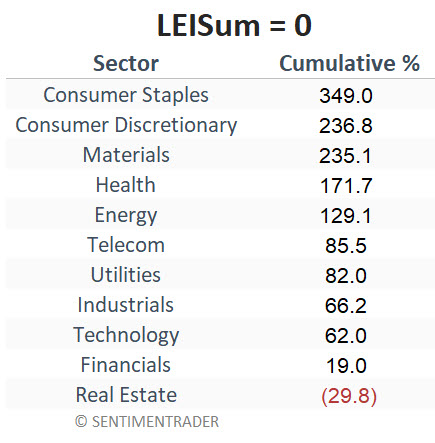
Sector performance while LEISum = 0
A reading of 0 means the leading economic indicators are pointing toward the potential for an economic contraction. A reading of 0 means that the latest monthly reading for the leading indicators index is below its 12-month EMA, BUT the six-month moving average of monthly readings is below the six-month moving average at the end of last month (i.e., the six-month MA is trending lower).
The table below ranks the sectors by cumulative performance during all 0 LEISum periods. The results seem to bear out the conventional wisdom that investors are better off in defensive sectors during periods of economic uncertainty. Consumer staples are the biggest winners, followed by consumer discretionary, materials, healthcare, and energy. Real estate has shown a loss, and financials a small gain.
What the research tells us…
Our LEISum indicator now stands at a reading of +3. The data presented above suggests that allocating capital to different sectors based on the level of economic growth implied by the performance of the leading economic indicators may be beneficial. If nothing else, the data lends weight to the conventional wisdom that real estate and technology are the places to be in a strong economy and that defensive sectors are the places to be in a weaker economic environment.