
Sectors in springtime

Key points
- The stock market has shown a tendency to advance during the late winter to early-spring period
- Individual sectors have developed their unique tendencies over the year
- This piece tests sectors during the same period tested previously with stock index ETFs
An important time of the year
In this article, I highlighted the performance of four stock index ETFs during the late winter to early spring period extending from the closing on Trading Day of the Year (TDY) #56 through TDY #83. For 2023, this period extends from the close on 2023-03-23 through 2023-05-02.
This piece will focus instead on the 11 S&P 500 Index sectors. For analysis purposes, we will use a sector index database that began in 1953. From 1953 to 1991, it used the Fama French database and, starting in 1991, uses the actual S&P 500 sector indexes.
These sectors can be traded via ETFs, as shown in the table below.
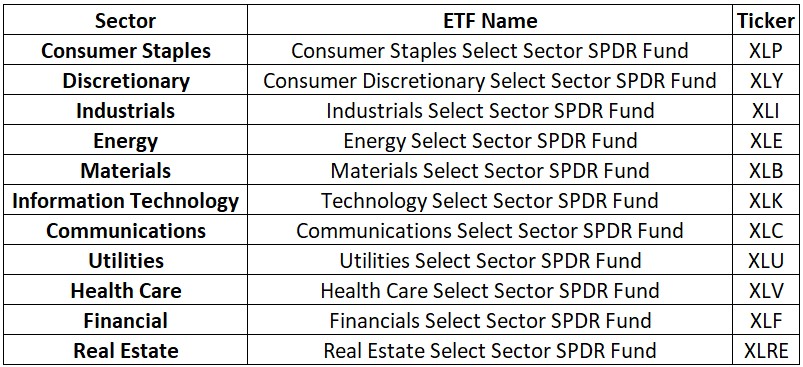
A closer look at sector seasonality
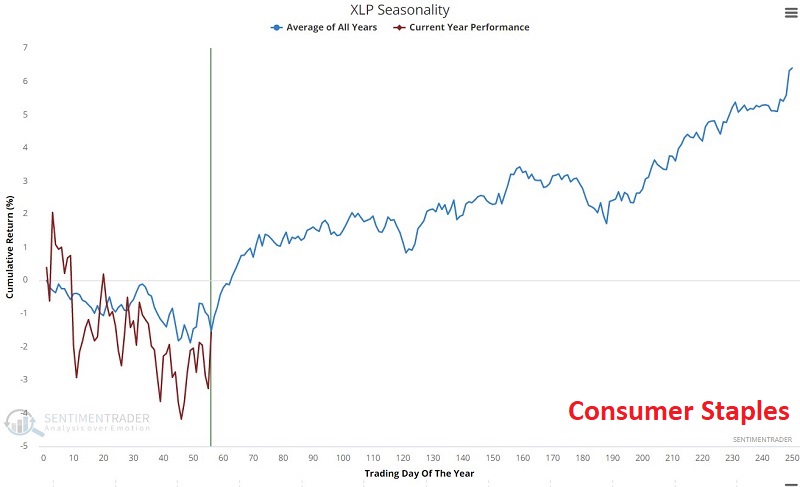
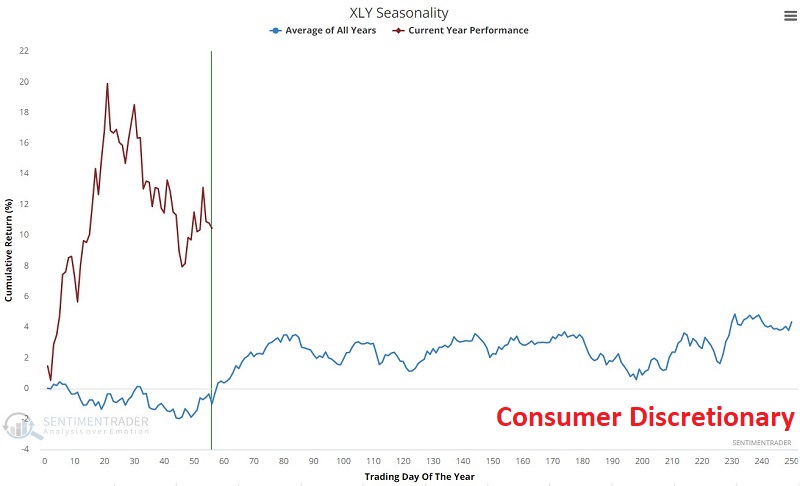
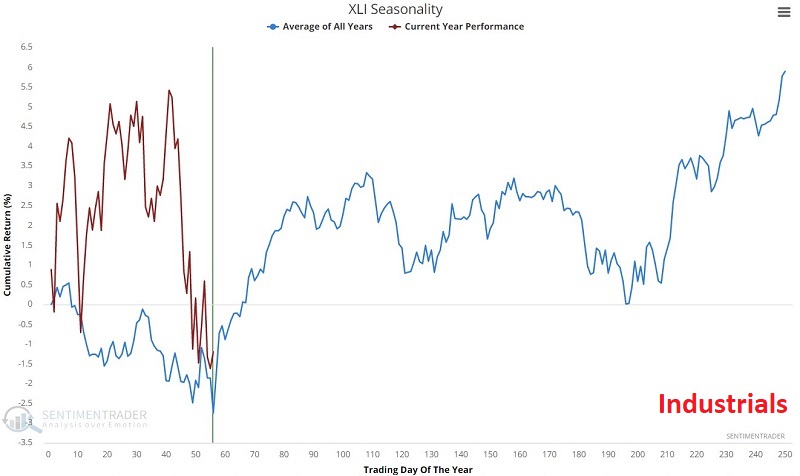
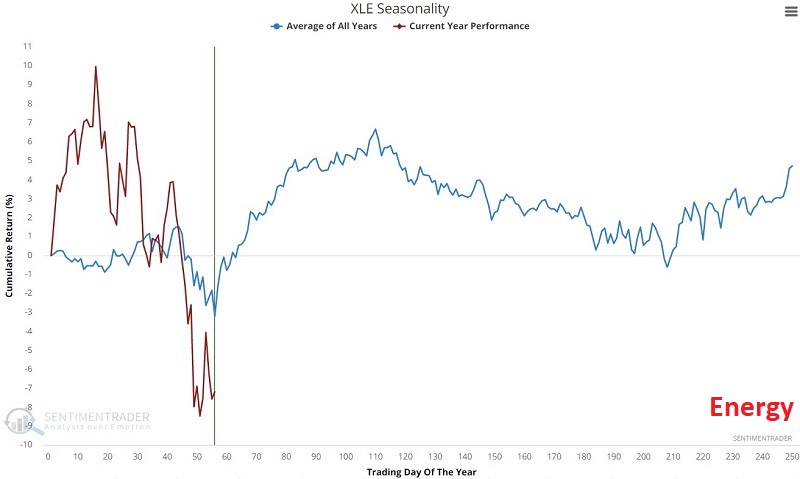
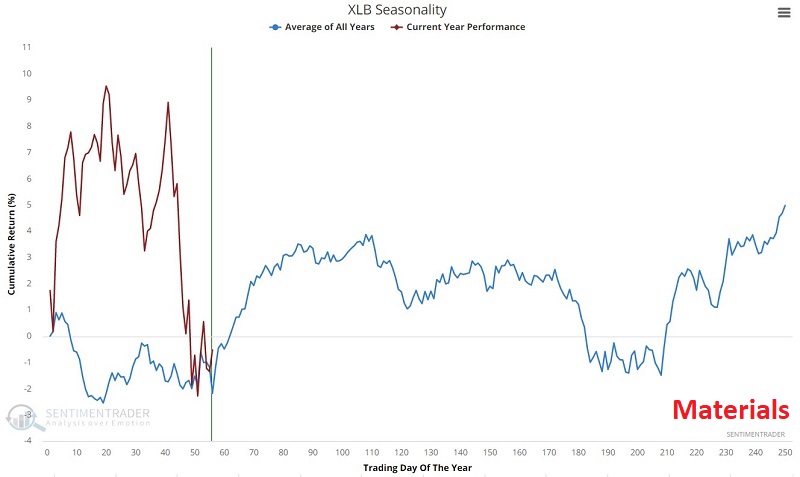
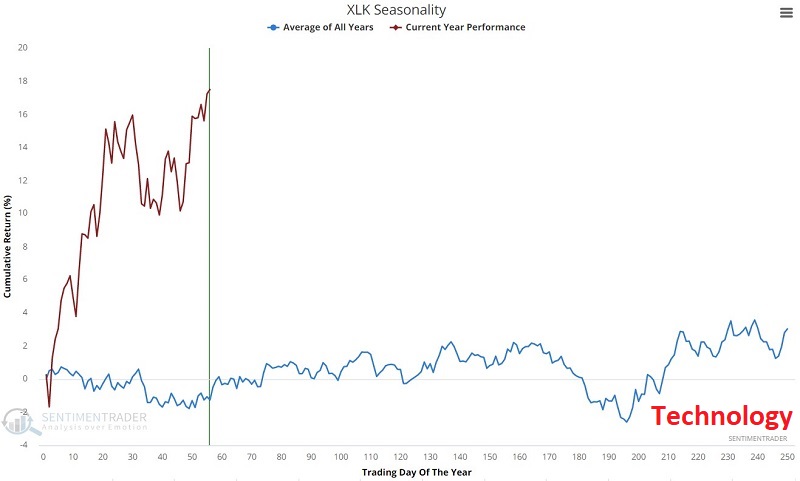
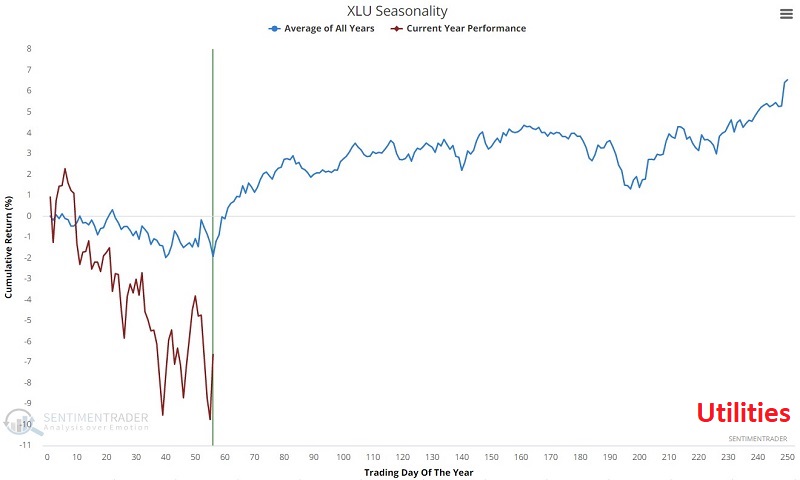
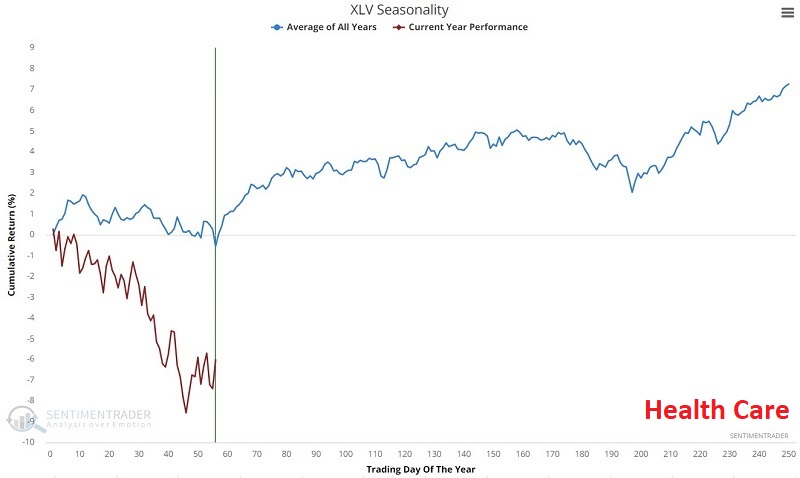
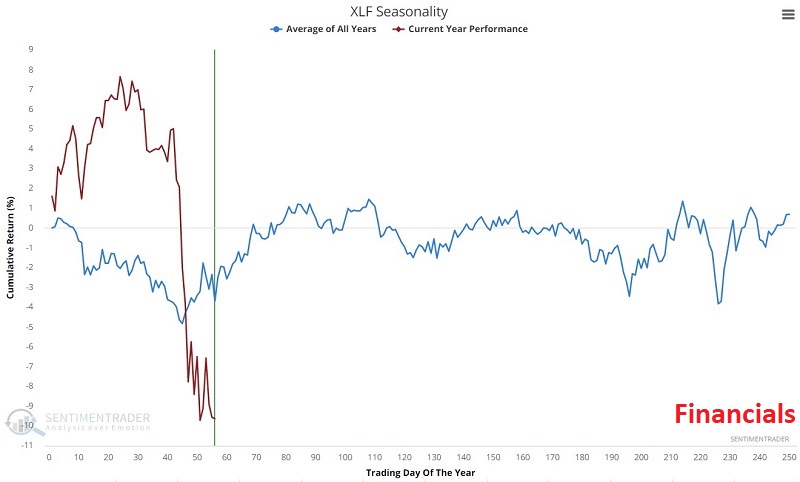
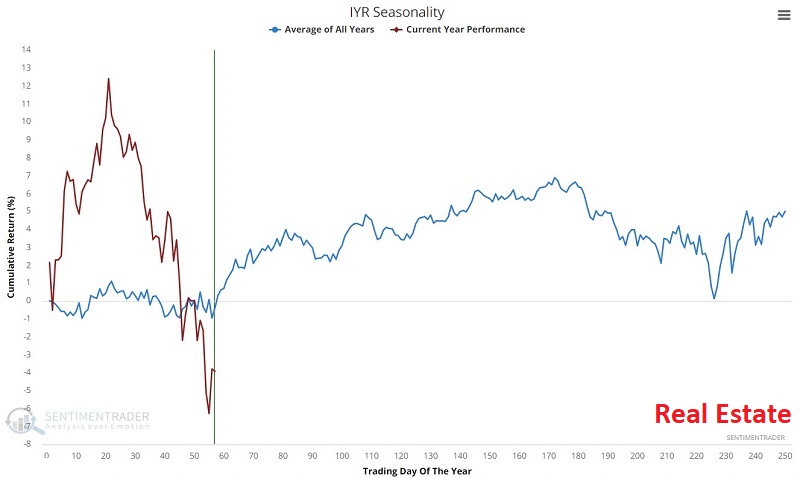
Before displaying index results from 1953 through 2022, the charts below display the annual seasonal trend (blue line) for the ETFs listed in the table above and their performance so far this year (brown line). Note that each index may have its unique mid-winter to early-spring favorable period start and end dates. But for our testing purposes - and to compare apples-to-apples - all sectors will be tested using the TDY #56 through TDY #83 period.
Note that our database does not include seasonality charts for Communications (XLC) or Real Estate (XLRE). Communications are excluded in the charts below, and the iShares U.S. Real Estate ETF (IYR) is included as a proxy for ticker XLRE.
A closer look at sector index performance
Now let's look at the cumulative performance for each sector during the TDY #56 through TDY #83 period since 1953 for the sectors listed. The table below summarizes performance.
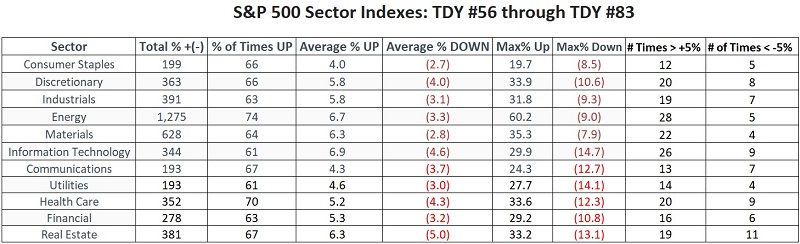
Energy has been the top overall performer by far, with a cumulative gain of +1,275%. Materials are a distant second, with a cumulative growth of +628%. Utilities and Communications bring up the rear with meager cumulative returns of +193%.
It is also essential to peruse the "Max% Down" and "# of Times < -5%" columns to remind us that seasonality is "climate, not weather" and that there are no guarantees on a year-to-year basis. These values also remind us why price confirmation is essential to using seasonality.
For perspective, the chart below displays the growth of $1 in the two top-performing (Energy and Materials) and bottom-performing (Communications and Utilities) sectors only during the TDY #56 through TDY #83 period from 1953 into 2023.
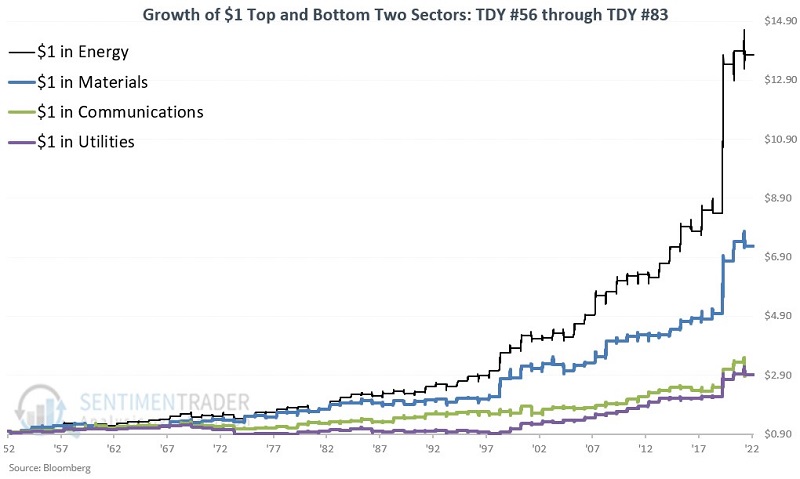
It is interesting to note that Communications and Utilities did not necessarily perform poorly - they just failed to perform as well as other sectors during this particular seasonal period.
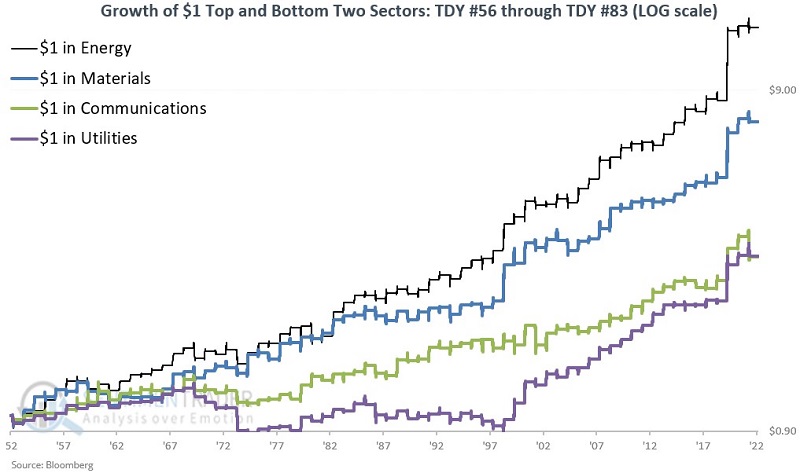
The chart below displays the same information on a logarithmic scale and helps highlight the long-term consistency demonstrated by Energy and Material.
What the research tells us…
The stock market has performed well from late March into early May over the past 70 years. Among sectors, Energy and Materials have performed head and shoulders better than other sectors since 1953. Nevertheless, the usual caveats must be kept firmly in mind. There is no guarantee from year to year that any particular sector will show a gain - nor that it will not experience a significant decline. Likewise, there is no guarantee that energy and/or materials will continue to lead the pack. As always, seasonality primarily tells you "where to look" for potential opportunities. Intelligently allocating capital and ruthlessly managing risk remains the responsibility of each investor.