
Sectors and factors meet the year-end rally

Key points
- A recent piece highlighted the tendency for the stock market to advance during a specific "year-end rally" period
- In this piece, we look at performance among various market sectors and factors
- We also highlight two that - when combined - appear to offer a long-term edge
Defining the period
The period we will consider here:
- Starts at the close of the Monday before Thanksgiving
- Ends at the close of the third trading day of the following year
For 2024-25, this period extends from the close on 2024-11-25 through 2025-01-06.
Measuring historical results
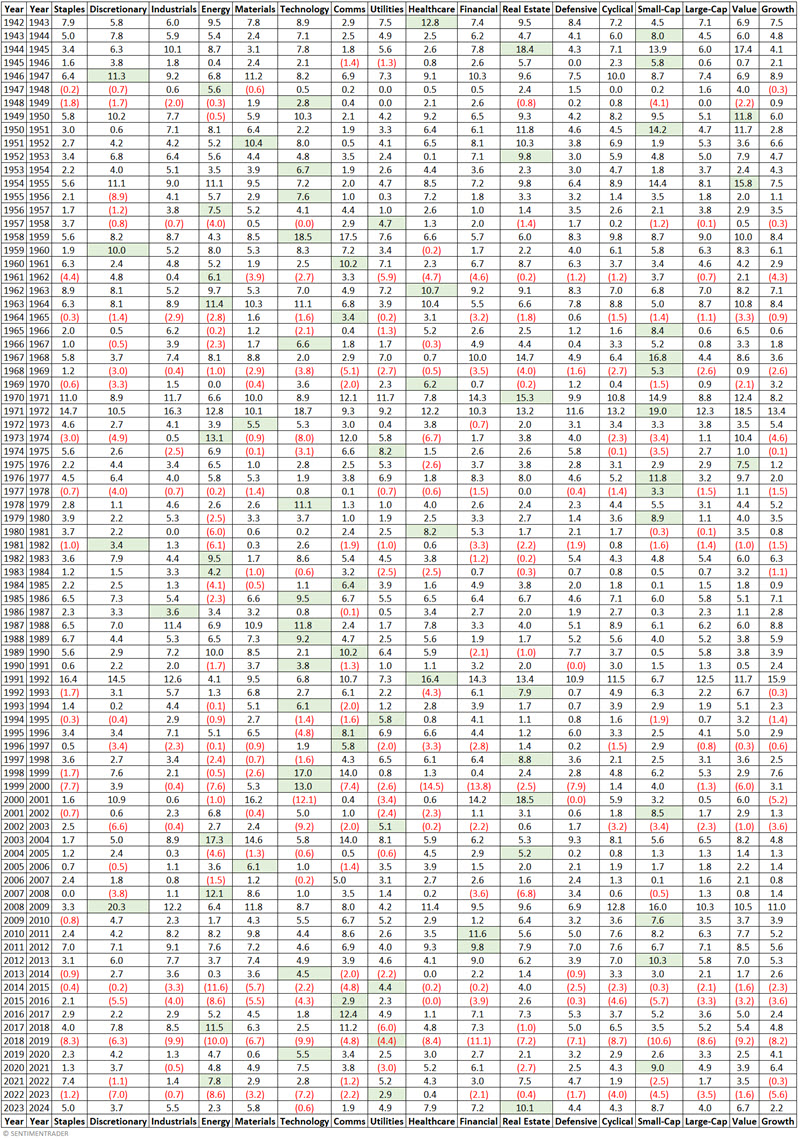
For the test below, we will examine the performance of the eleven S&P 500 sectors and the six S&P 500 factors only during the year-end rally period described above, starting in 1942.
The table below displays year-by-year "year-end rally" period results. The top performer for each year is highlighted in green.
The table below summarizes the results. Note the color coding:
- The top performer in each category is highlighted in green
- The second-best performer in each category is highlighted in blue
- The third-best performer in each category is highlighted in orange
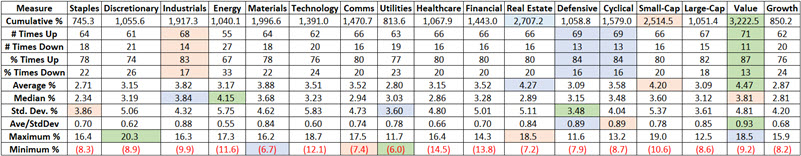
Interestingly, even though Value was only the top performer in three of the past 82 year-end rally periods, it was presumptively the top performer overall. The second largest cumulative gain was in the real estate sector.
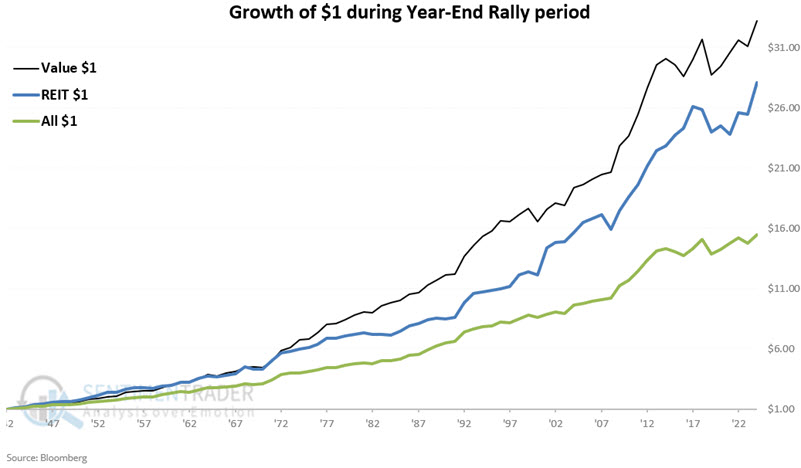
The chart below displays the hypothetical growth of $1 invested in Value (black line) and Real Estate (blue line) versus $1 invested equally in all sectors and factors (green line).
A closer look
Does this mean investors should put all their money in Value and Real Estate between November 25th and January 6th? That's not really the argument being made. But as a thought experiment, let's take a closer look.
Let's consider two hypothetical portfolios:
- One invests equally between Value and Real Estate on the close Monday before Thanksgiving and sells at the close of the third trading day of the following year.
- The other invests equal amounts across all eleven S&P 500 sectors and all six S&P 500 factors during the same period each year
- Both portfolios are considered "Flat" (i.e., with no position between early January and the next Monday before Thanksgiving.
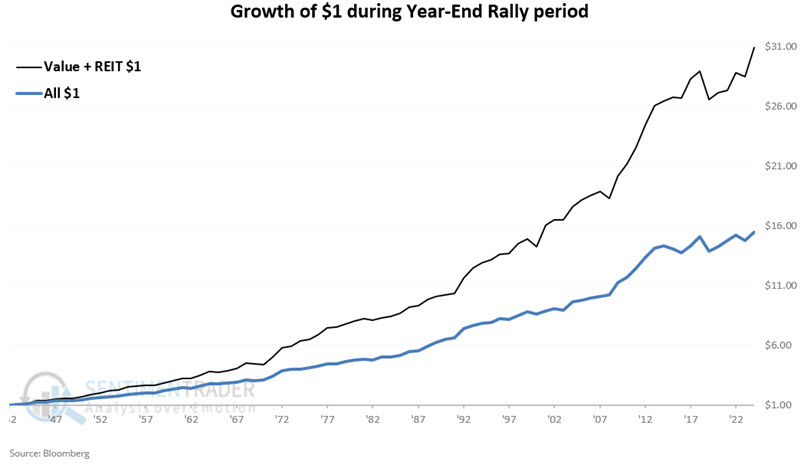
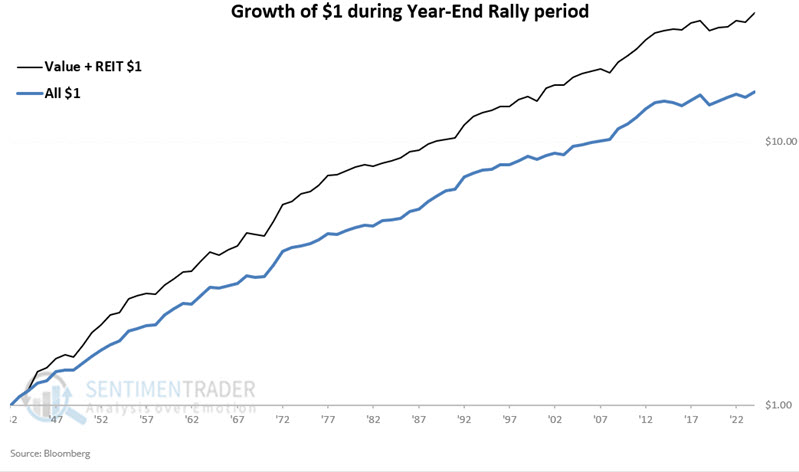
The chart below displays the hypothetical growth of $1 in both portfolios.
The chart below displays the same results on a logarithmic scale.
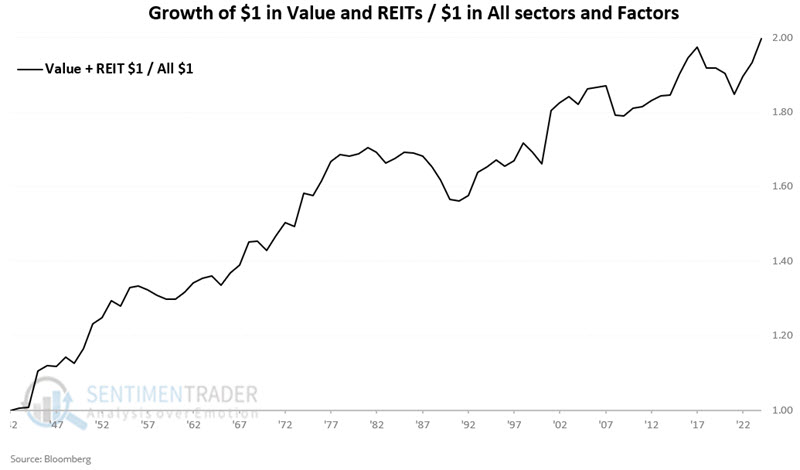
The chart below divides the growth of $1 in Value and Real Estate by the growth of $1 in all sectors and factors.
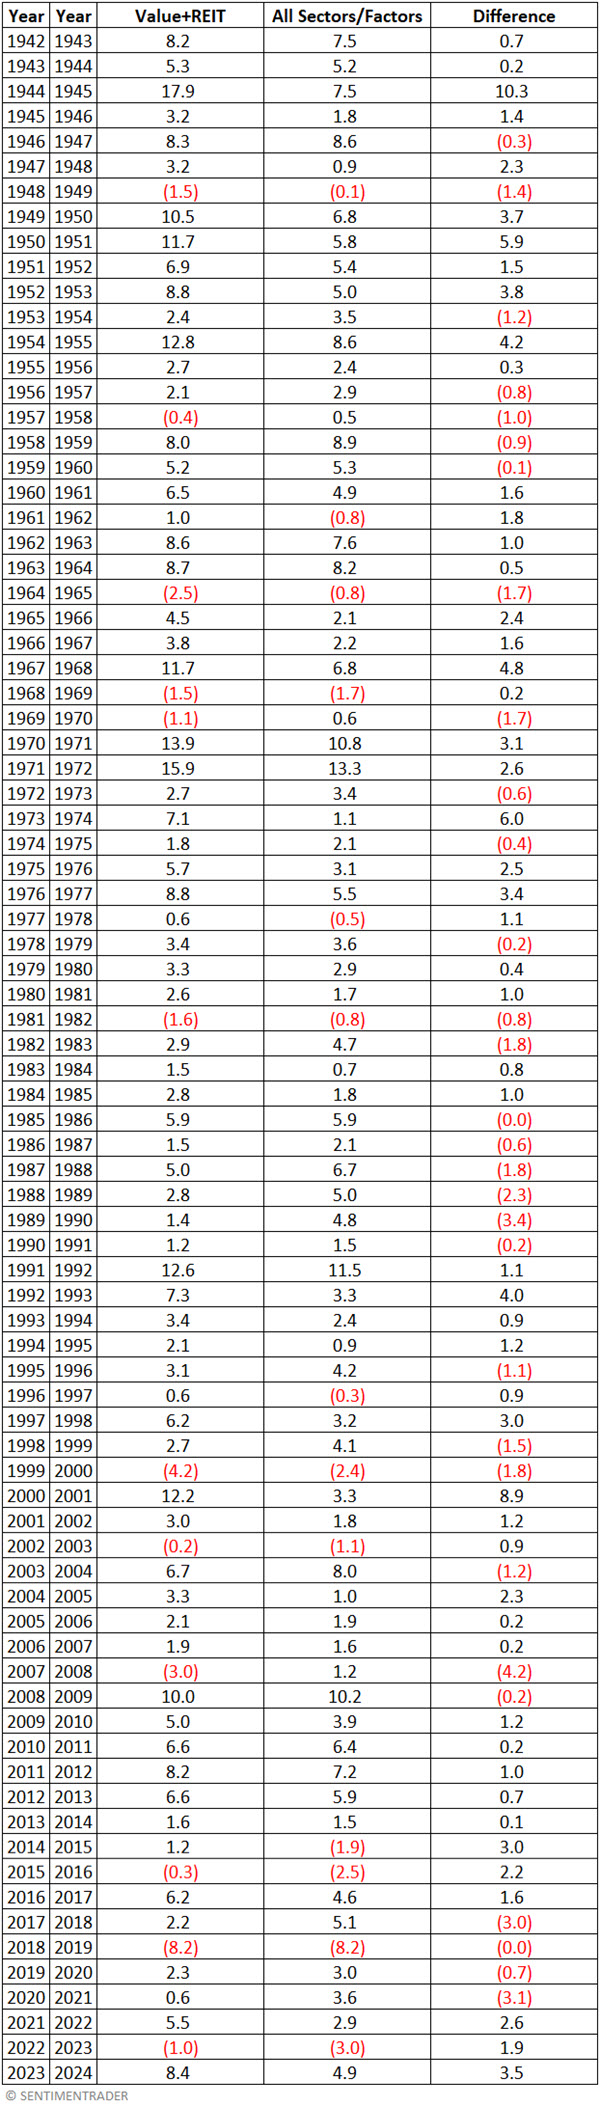
The table below displays year-by-year results.
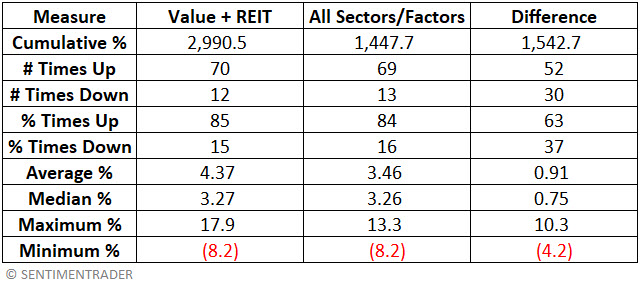
The table below summarizes the results.
ETFs for real-world trading
For investors interested in digging deeper, note that the iShares S&P 500 Value ETF (ticker IVE) tracks the S&P 500 Value Index and that the Real Estate Select Sector SPDR Fund (ticker XLRE) tracks the S&P 500 Real Estate sector.
What the research tells us…
Over many decades, the combination of Value and Real Estate has significantly outperformed the average of all sectors and factors during the year-end rally period delineated above. Note the cumulative return that doubles the average return of all sectors and factors, the 85% win rate, the consistent rise in the last chart above (showing the relative performance of Value and Real Estate versus all sectors and factors), and the fact that Value and Real Estate have outperformed the average of all sectors and factors in 63% of the last 82 years. The one overarching caveat remains that there is no guarantee of outperformance in 2024-2025.