Products
SentimenTrader Trading Tools
‍
Backtest Engine
My Trading Toolkit
Correlation Analysis
Seasonality
Market Prediction
Indicators & Data API
‍
Proprietary Indicators & Charts
Market Data API
Strategies & Scanner
‍
50+ Trading Strategies
Smart Stock Scanner
Smart Option Scanner
Research Reports
‍
Research Solutions
Reports Library
Free Resources
Simple Backtest Calculator
Simple Seasonality Calculator
The Kelly Criterion Calculator
Sentiment Geo Map
Public Research Reports
Education
Sentiment Indicators
Technical Indicators
Pricing
Company
About
In the News
Testimonials
Client Success Stories
Contact
Log inLoginSign up
< BACK TO ALL REPORTS

Sectors and factors in August and September are mixed bag

Jay Kaeppel
2024-08-02
Since 1946, stock market performance during August and September has been very hit-or-miss. Individual sectors and factors have offered little in the way of consistency. Several sectors do, however, stand out as places to exercise caution. We highlight the details herein.

Key points

  • August and September can be challenging months for stocks in general
  • Sector and factor performance is also very hit-or-miss during this time
  • Materials, Industrials, and Technology have been the worst August/September performers since WWII

Sectors and Factors in August and September

In this article, we noted the overall stock market's tendency to exhibit greater weakness during August and September than at any other time of year.

The table below displays the percentage of years when a given sector/factor showed a net price gain from the end of July to the end of September and the cumulative percentage return achieved by holding it only during these two months every year since 1946.

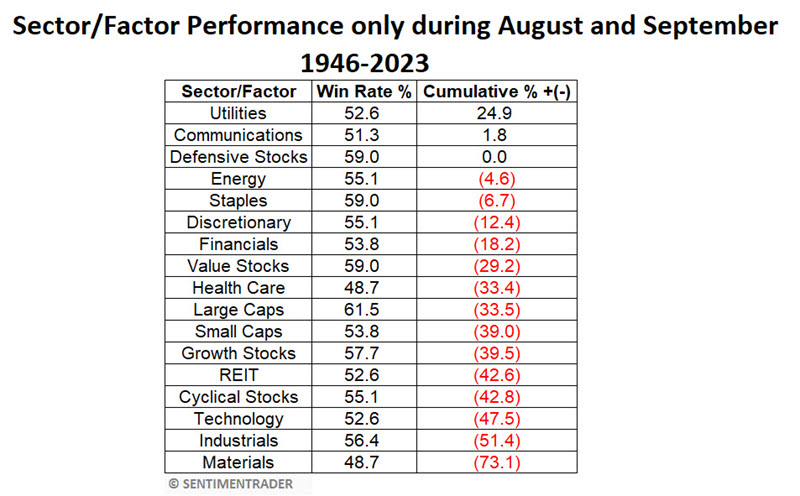
These results are not much to write home about. Even the apparent "top performers" (Utilities and Telecommunications) have struggled mightily in recent years during August and September, as seen in the charts below.

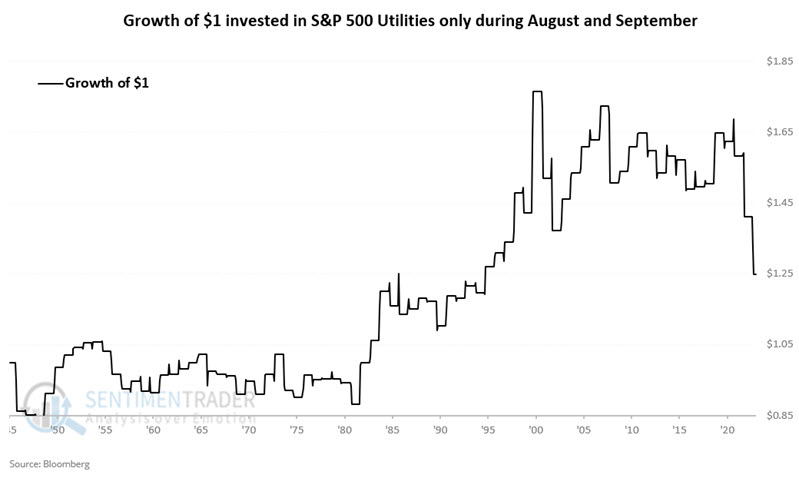
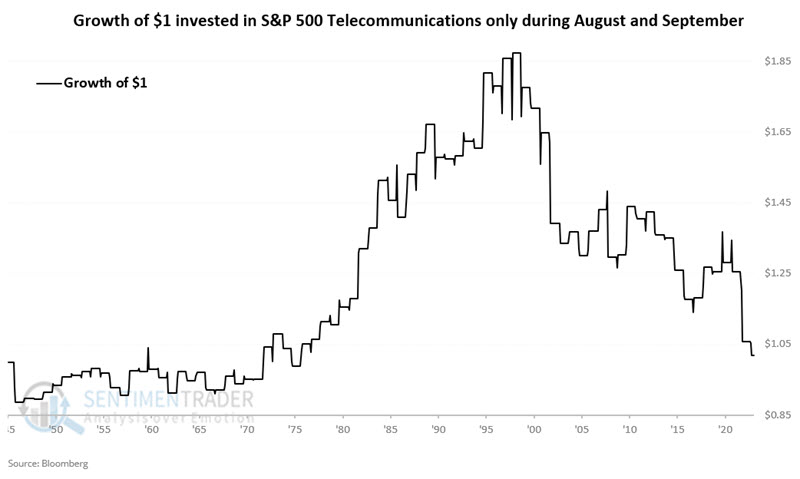
These two "best" sectors were pretty reliable in August/September performances into the late 1990s but have struggled mightily ever since.

A closer look at the cellar dwellers

The charts below display the hypothetical growth of $1 invested in the Materials, Industrials, and Technology sectors only during August and September every year since 1946.

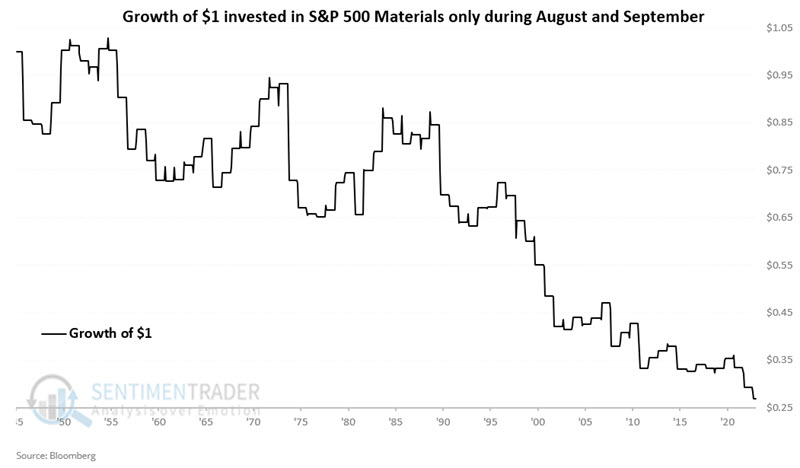
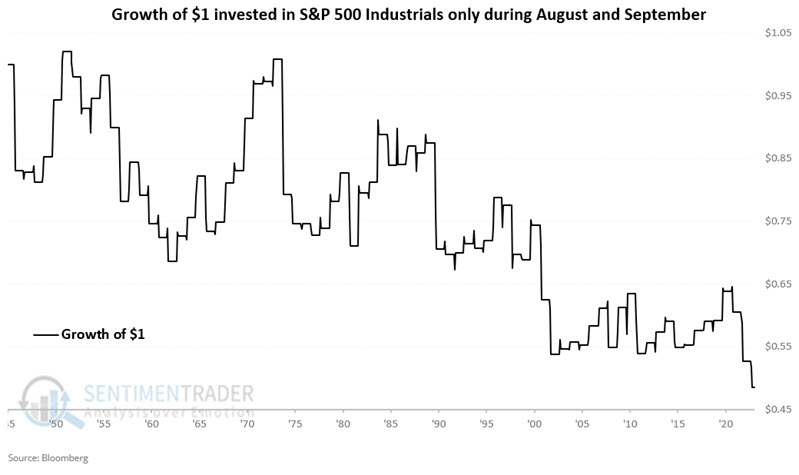
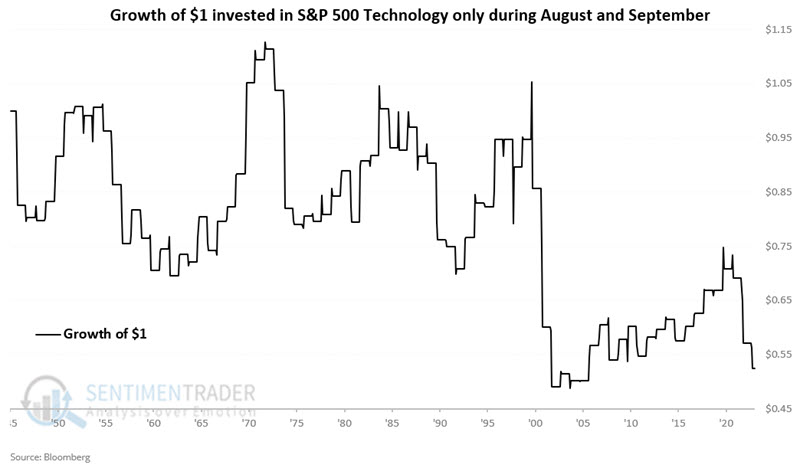
So, should investors avoid these sectors during August and September? It's complicated. On a year-by-year basis, any of these sectors can perform exceptionally well during this supposedly "weak" two-month period.

What the research tells us…

No "advice" is built into or implied by the data presented above. For those inclined to hedge or raise cash as part of their investment plan, there appears to be some long-term utility in considering these actions during August and September. At the very least, investors with a longer-term outlook might "gird their loins" and adjust their expectations during these two months each year to more of a "hope for the best, prepare for the worst" attitude. Shorter-term traders should pay particular attention to price trends and not be shy about playing the short side of specific sectors if price weakness unfolds.

PRODUCTS
SentimenTrader
Trading Tools
Indicators & Data API
‍
Strategies & Scanner
‍
Research Reports
FREE
RESOUrCES
Simple Backtest
Calculator
Simple Seasonality
Calculator
The Kelly Criterion
Calculator
Sentiment Geo Map
‍
Public Research Reports
‍
Education
Sentiment Indicators
‍
Technical Indicators
‍
Pricing
Bundle pricing
‍
FAQ
‍
Announcements
‍
COMPANY
‍
About
‍
In the News
‍
Testimonials
‍
Client Success Stories
CONTACT
‍
General Inquiries
‍
Media Inquiries
‍
Financial Professionals Inquiries
‍
© 2026 Sundial Capital Research Inc. All rights reserved.
Setsail Marketing
TermsPrivacyAffiliate Program
Risk Disclosure: The information and tools provided are for research and analytical purposes only and are not intended as investment advice. Market analysis involves uncertainty, and outcomes may differ from expectations. Users should conduct their own due diligence and consider their individual circumstances before making any financial decisions. Past performance is not necessarily indicative of future results.

Hypothetical Performance Disclosure: Hypothetical performance results have many inherent limitations, some of which are described below. No representation is being made that any account will or is likely to achieve profits or losses similar to those shown; in fact, there are frequently sharp differences between hypothetical performance results and the actual results subsequently achieved by any particular trading program. One of the limitations of hypothetical performance results is that they are generally prepared with the benefit of hindsight. In addition, hypothetical trading does not involve financial risk, and no hypothetical trading record can completely account for the impact of financial risk of actual trading. for example, the ability to withstand losses or to adhere to a particular trading program in spite of trading losses are material points which can also adversely affect actual trading results. There are numerous other factors related to the markets in general or to the implementation of any specific trading program which cannot be fully accounted for in the preparation of hypothetical performance results and all which can adversely affect trading results.

Testimonial Disclosure: Testimonials appearing on this website may not be representative of other clients or customers and is not a guarantee of future performance or success.