
Sector opportunities - and potential weak spots - in the weeks ahead

Key points
- Several market sectors are entering significant seasonal periods
- ETFs entering unfavorable periods include XLB, XLE, XLF, XLI, XME, and XOP
- One potential exception is in the biotech sector, represented by the ticker IBB
- Investors should carefully consider how much exposure they want in the highlighted sectors, and traders might consider looking for short-term opportunities in the sectors highlighted below
Several stock market sectors enter the annual "danger zone"
Several stock market sectors have demonstrated a tendency to show weakness around this time of year. Please note that "seasonal weakness" is not the same as a "sell signal." By itself, seasonality is a condition, not a signal. The real message for the sectors highlighted below is more one of an investor/trader may:
- Consider lightening up any existing positions in these sectors
- Carefully consider if it is worth buying/holding these sectors at this time
- Consider a short position (or a put option position) to take advantage of potential price weakness
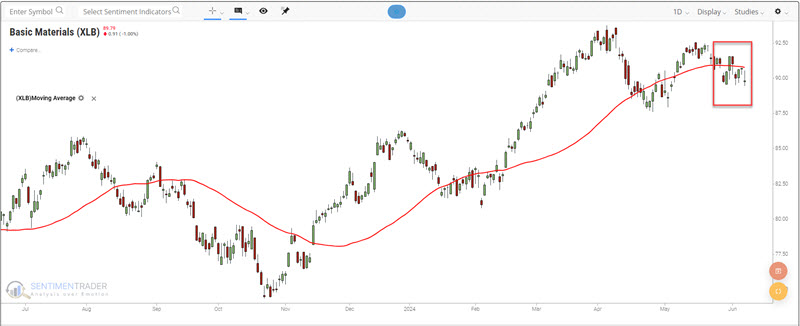
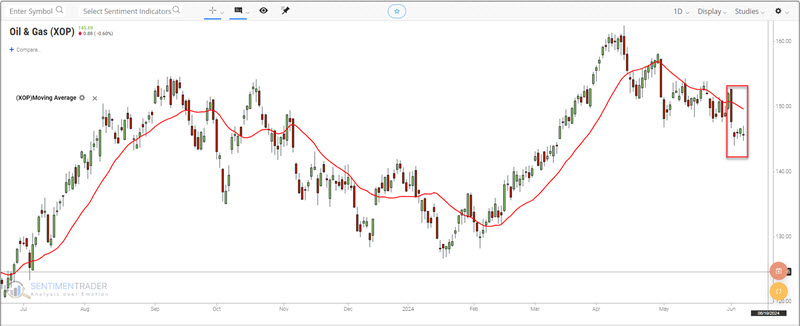
The sectors include XLB, XLE, XLF, XLI, XME, and XOP. For each, we will examine the history of the impending seasonal period and price action compared to its 50-day moving average.
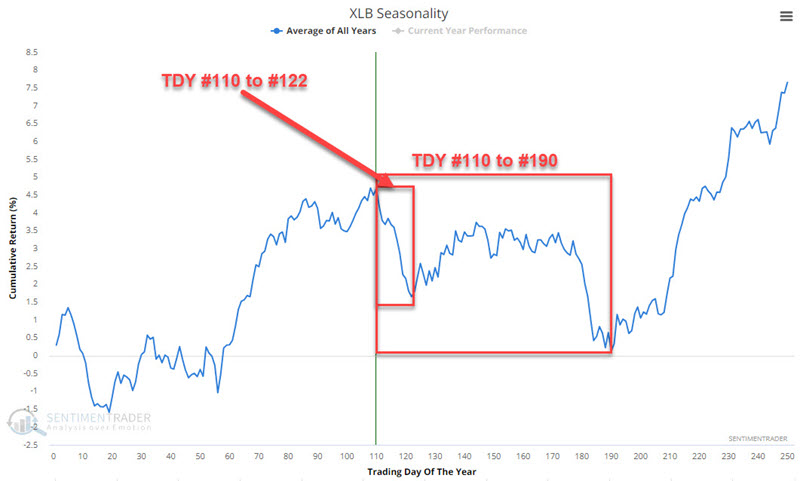
The Materials Select Sector SPDR Fund (ticker XLB):
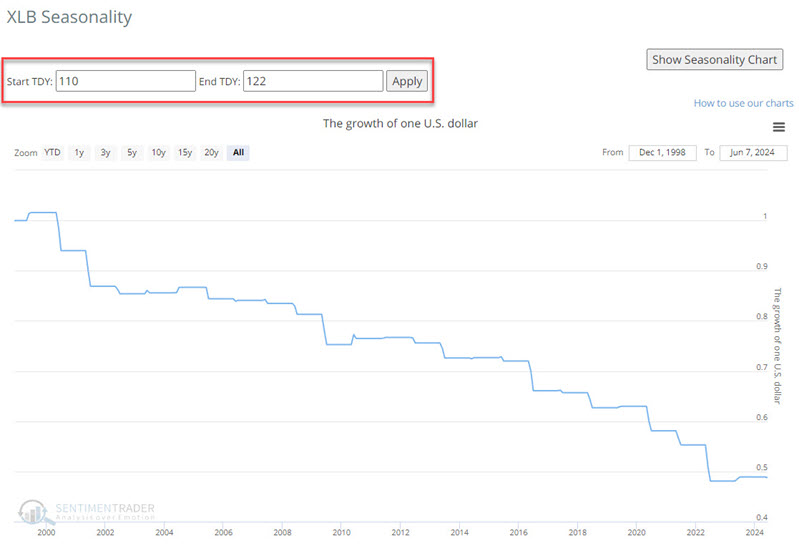
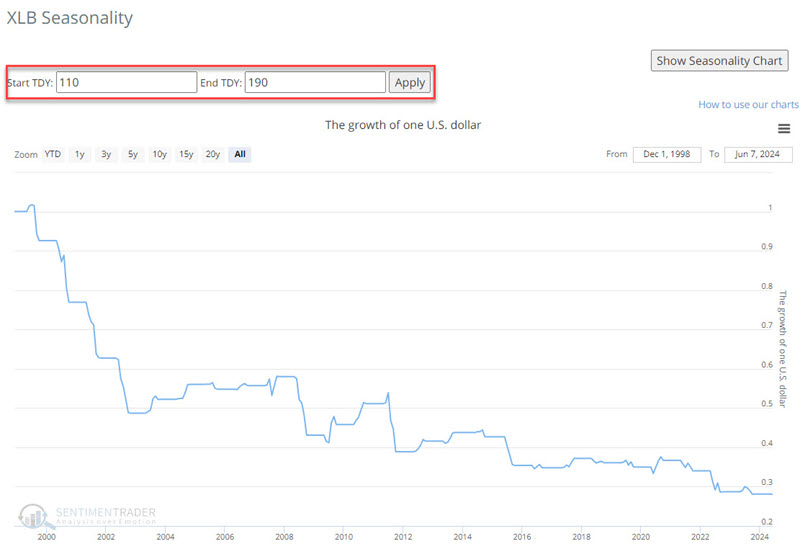
The chart below shows that XLB tends to show weakness from Trading Day of Year (TDY) #110 through TDY #122 and from #110 to #190. For 2024, these periods extend from the close on 2024-06-07 and 2024-06-26 and from 2024-06-07 and 2024-10-02, respectively.
The charts below show the hypothetical growth of $1 invested in XLB only during these periods since XLB started trading.
The Energy Select Sector SPDR Fund (ticker XLE):
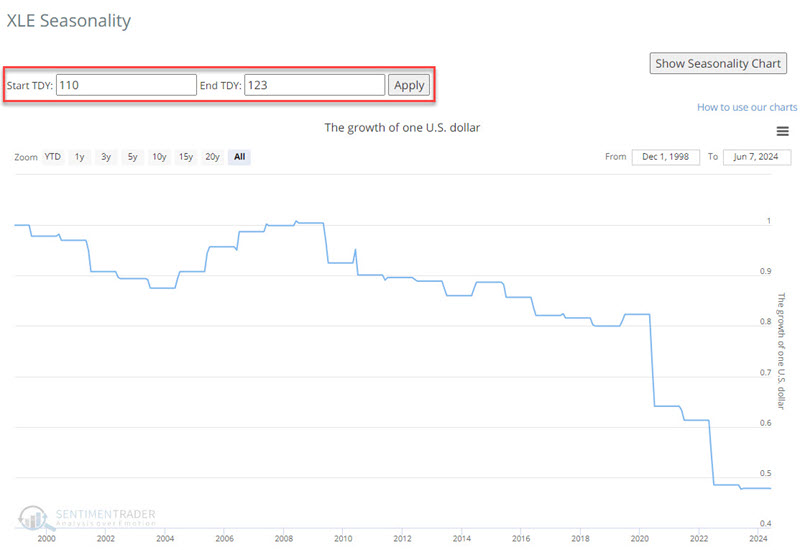
The chart below displays that XLE tends to show weakness from Trading Day of Year (TDY) #110 through TDY #123. For 2024, this period extends from the close of 2024-06-07 to 2024-06-27.
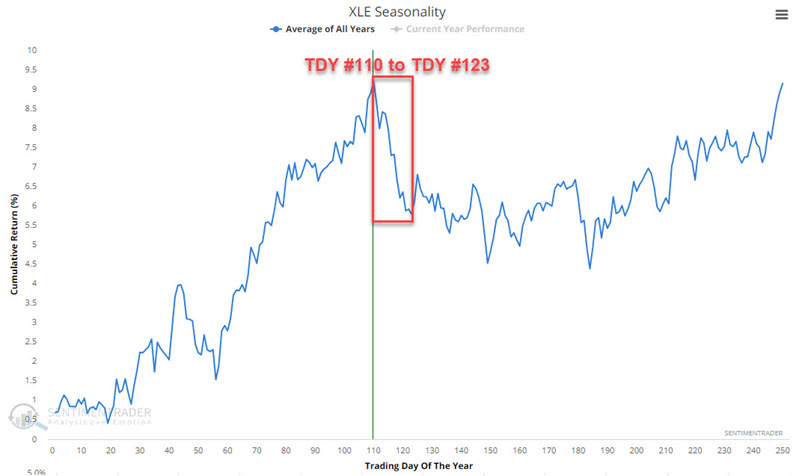
The charts below show the hypothetical growth of $1 invested in XLE only during this period since XLE started trading.
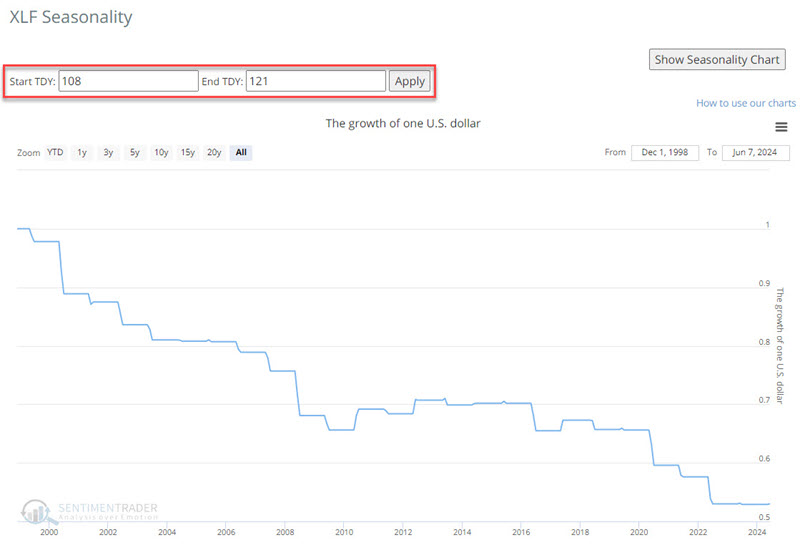
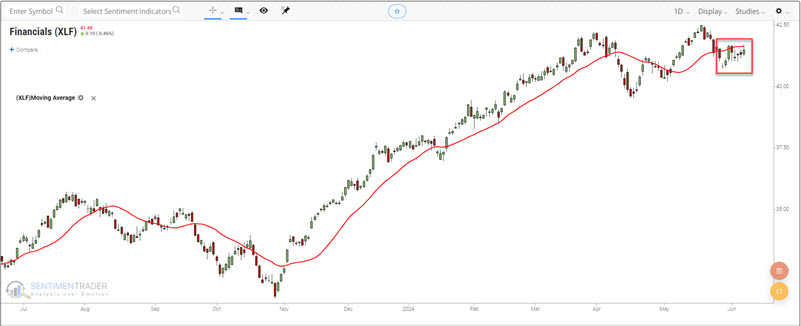
The Financials Select Sector SPDR Fund (ticker XLF):
The chart below displays that XLF tends to show weakness from Trading Day of Year (TDY) #108 through TDY #121. For 2024, this period extends from the close of 2024-06-05 to 2024-06-25.
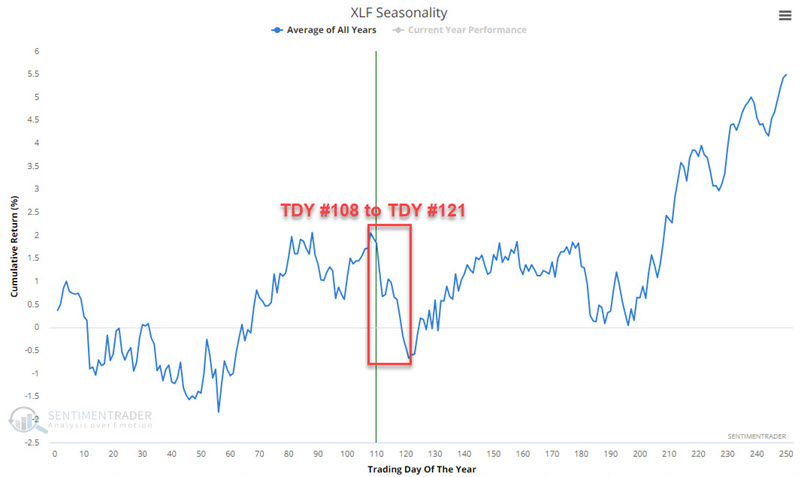
The charts below show the hypothetical growth of $1 invested in XLF only during this period since XLF started trading.
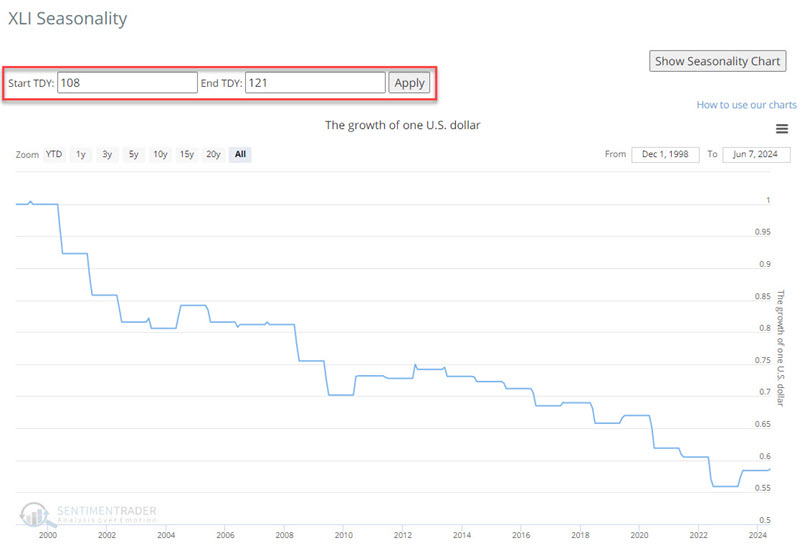
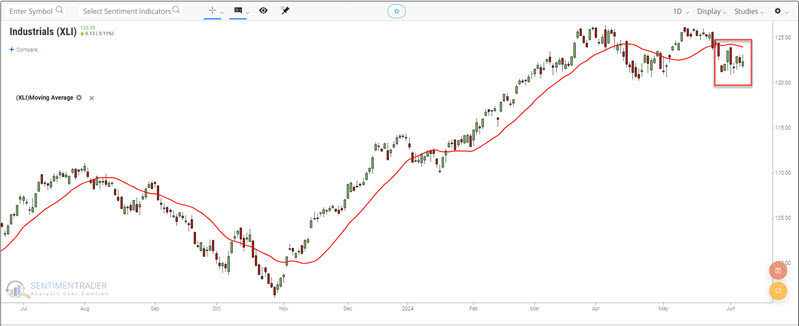
The Industrials Select Sector SPDR Fund (ticker XLI):
The chart below displays that XLI tends to show weakness from Trading Day of Year (TDY) #108 through TDY #121. For 2024, this period extends from the close of 2024-06-05 to 2024-06-25.
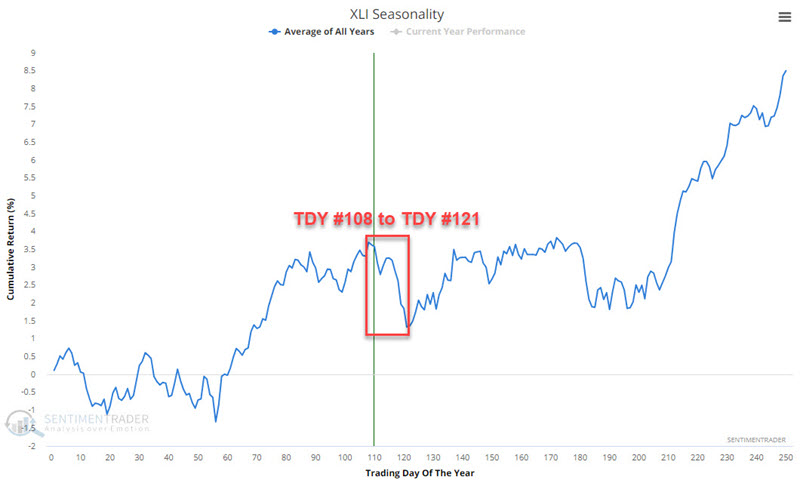
The charts below show the hypothetical growth of $1 invested in XLI only during this period since XLI started trading.
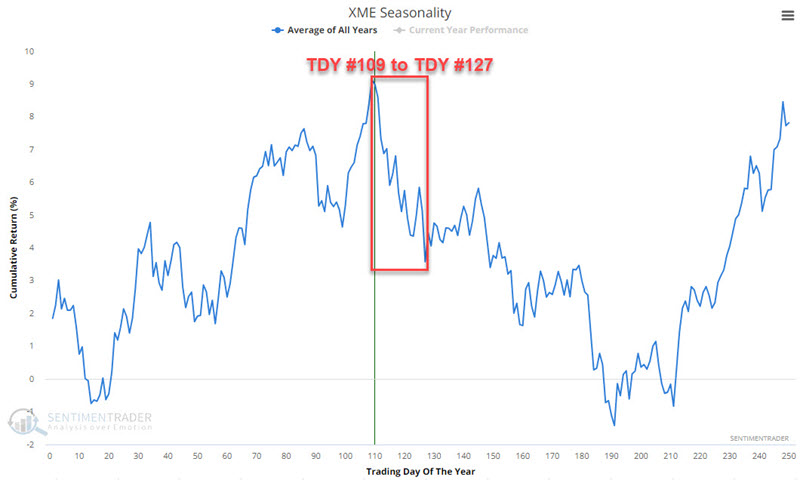
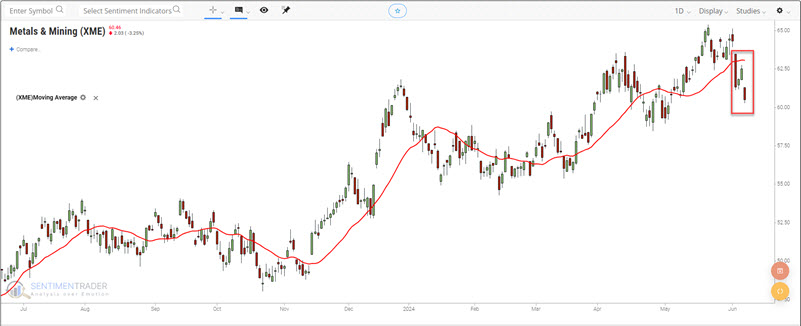
SPDR S&P Metals and Mining ETF (ticker XME):
The chart below displays that XME tends to show weakness from Trading Day of Year (TDY) #109 through TDY #127. For 2024, this period extends from the close of 2024-06-06 to 2024-07-03.
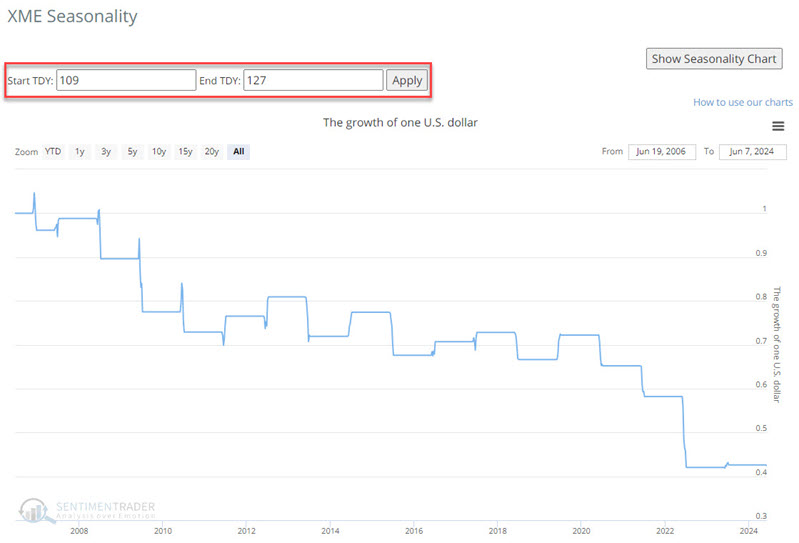
The charts below show the hypothetical growth of $1 invested in XME only during this period since XME started trading.
SPDR S&P Oil & Gas Exploration & Production ETF (ticker XOP):
The chart below displays that XME tends to show weakness from Trading Day of Year (TDY) #110 through TDY #160. For 2024, this period extends from the close of 2024-06-07 to 2024-08-20.
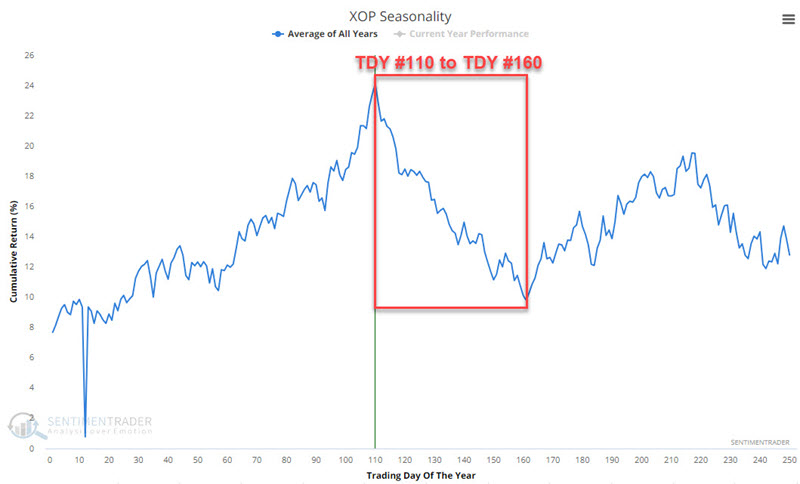
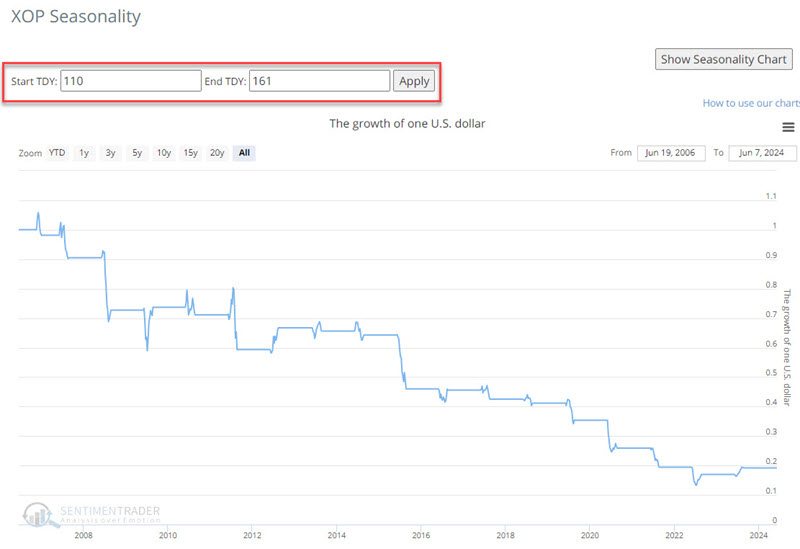
The charts below show the hypothetical growth of $1 invested in XOP only during this period since XOP started trading.
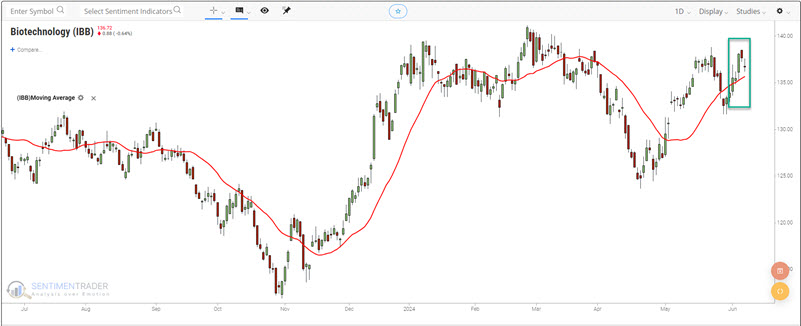
One potential exception is biotech
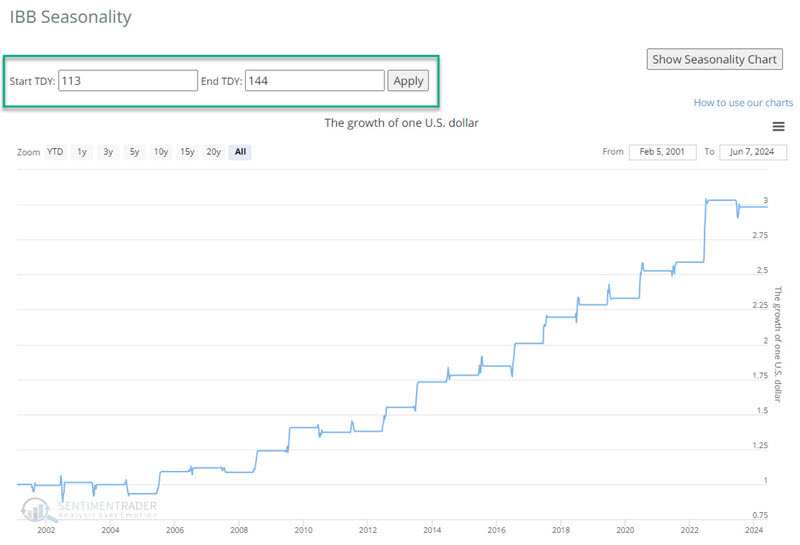
iShares Biotechnology ETF (ticker IBB):
The chart below displays that IBB tends to show strength from Trading Day of Year (TDY) #113 through TDY #144. For 2024, this period extends from the close on 2024-06-12 and 2024-07-29.
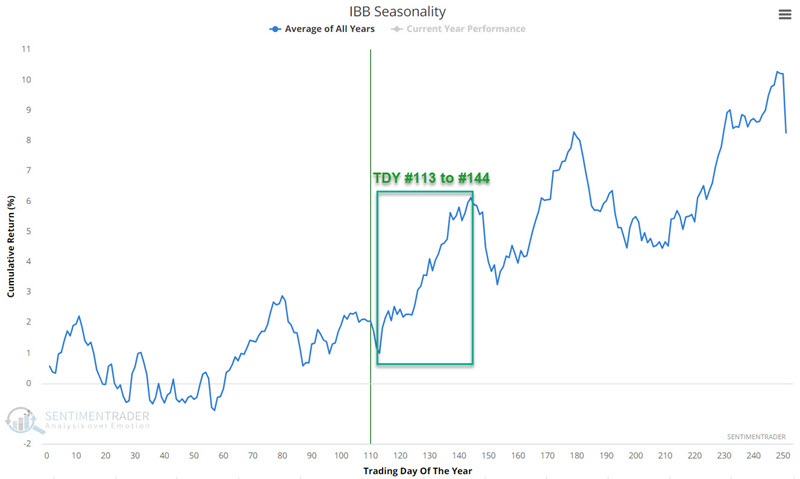
The charts below show the hypothetical growth of $1 invested in IBB only during this period since IBB started trading.
What the research tells us…
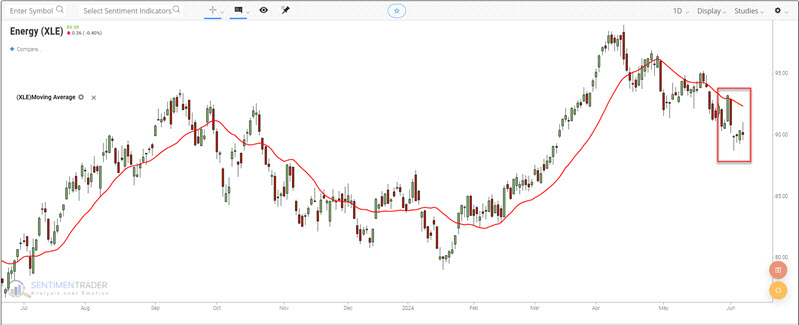
So is the message to "sell everything" in XLB, XLE, XLF, XLI, XME, and XOP and bet it all on biotech? Not at all. The real message is for investors to carefully consider how and where to allocate capital in the weeks ahead. The "Growth of $1" charts above highlight some persistently unfavorable trends for various sectors - and a persistently favorable trend for ticker IBB. There is no guarantee that any of these trends will play out in 2024 as they have in the past. However, as long as these ETFs remain on the side of their 50-day moving average, which matches their seasonal trend, alert traders may find opportunities, and cautious investors might consider standing aside.