
Sector breadth flashes an oversold signal

Key points
- As long as the market indexes remain below their July highs, the risk of a further decline remains, particularly during the late-August to mid-October period
- Still, several objective indicators have flashed favorable signals of late
- The Major Sector Breadth (%>50 Day Avg) recently joined the parade
Oversold breadth in an established uptrend tends to be favorable
In recent articles (see here and here), we have highlighted a variety of breadth and sentiment indicators that argue in favor of a continuation of the rally during the first seven months of 2023.
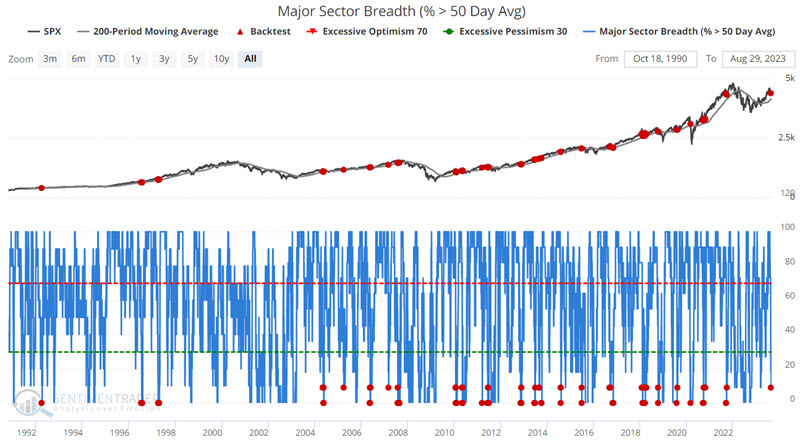
In this piece, we will highlight one more. As the name implies, the Major Sector Breadth (%>50 Day Avg) measures the % of 11 major sectors trading above their respective 50-day moving average. A decline to a low level can signify a potential buying opportunity in the market. However, it is typically more advantageous in an already established price uptrend.
The chart below highlights all dates when the Major Sector Breadth (%>50-Day Avg) indicator was below 10% while the S&P 500 Index closed above its 200-day moving average.
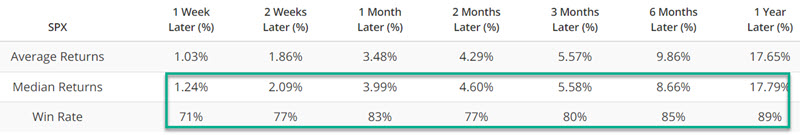
The table below summarizes SPX performance following signal dates. The key things to note are the high Win Rates and decent Median Returns, particularly for six months and one year.
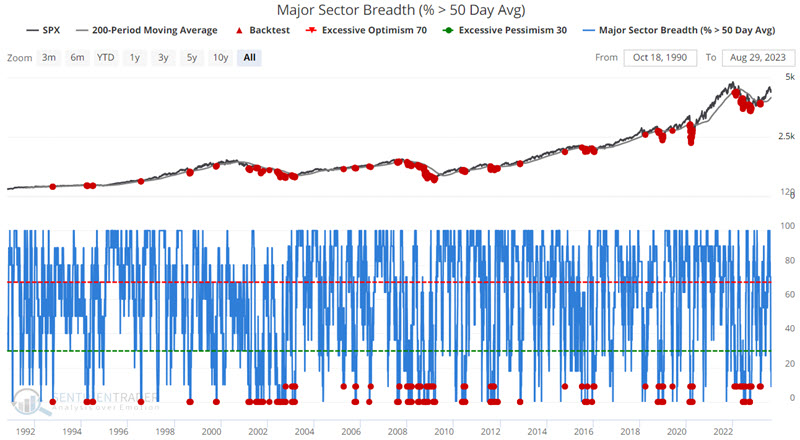
To understand why the underlying trend is important, the chart below displays all dates when the Major Sector Breadth (%>50-Day Avg) indicator was below 10% while the S&P 500 Index closed below its 200-day moving average.
The table below summarizes SPX performance following signal dates.
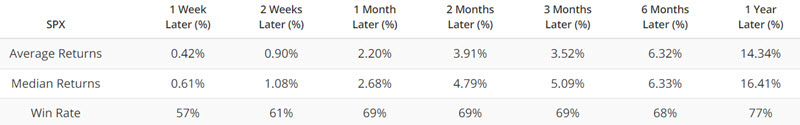
Note that results aren't "bad"; they are just inferior almost the board to results when the S&P 500 Index is above its 200-day average. Also note that during significant bear markets (2000-2002, 2007-2009, 2022), failed signals keep piling up.
What the research tells us…
Generally, no one should rely on one indicator to decide when to buy or sell. But as part of a weight-of-the-evidence approach, a setup such as the one highlighted above can serve a useful purpose in reminding longer-term investors to give the bullish case the benefit of the doubt - and to alert shorter-term traders to be on the lookout for a buying opportunity.