Products
SentimenTrader Trading Tools
‍
Backtest Engine
My Trading Toolkit
Correlation Analysis
Seasonality
Market Prediction
Indicators & Data API
‍
Proprietary Indicators & Charts
Market Data API
Strategies & Scanner
‍
50+ Trading Strategies
Smart Stock Scanner
Smart Option Scanner
Research Reports
‍
Research Solutions
Reports Library
Free Resources
Simple Backtest Calculator
Simple Seasonality Calculator
The Kelly Criterion Calculator
Sentiment Geo Map
Public Research Reports
Education
Sentiment Indicators
Technical Indicators
Pricing
Company
About
In the News
Testimonials
Client Success Stories
Contact
Log inLoginSign up
< BACK TO ALL REPORTS

Seasonality suggests gas prices can go lower

Jay Kaeppel
2022-08-23
Energy prices are high around the globe, and the fear of continued price shocks remains high. Nevertheless, at the moment, gasoline prices are trending lower. Seasonality suggests that this downtrend could continue a while longer.

Key Points

  • Energy prices have soared following the 2020 Covid lows
  • Nevertheless, crude oil and unleaded has peaked in June 2022 and have been trending lower still
  • Seasonality suggests a strong possibility that the price of gasoline is headed lower still

Unleaded gas seasonality

Unleaded gas futures are a highly cyclical market. Demand tends to ramp up as the first half of the calendar year progresses. Demand then slows as summer heads into fall. Finally, demand falls off drastically as the winter months approach. The typically annual pattern for price reflects this cyclical demand.

The chart below displays the Annual seasonal trend for unleaded gas futures and highlights the two key periods for gasoline traders. The sharp falloff in price in the year's second half is unmistakable.

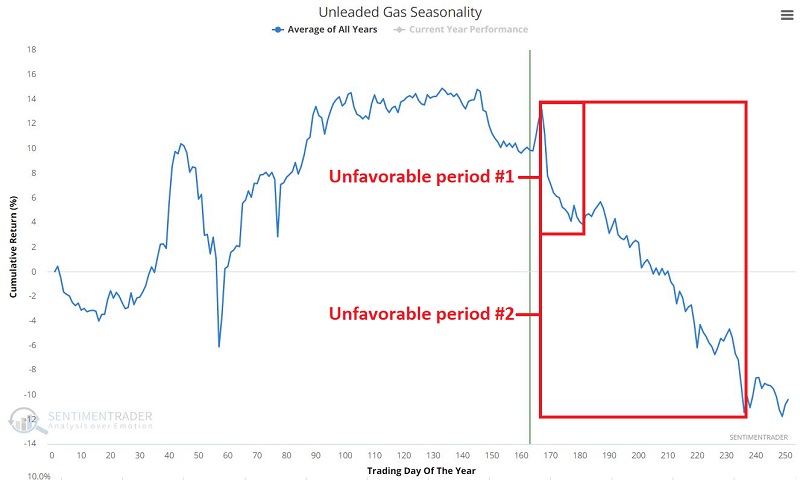
Unleaded gas futures contracts are for 42,000 gallons (which equals 1,000 barrels), and a 1-point movement in the contract price equals $420. 

Key period #1

Let's first focus on the period that extends from the close on Trading Day of the Year (TDY) #167 through the close on TDY #177. This is a very short window. Nevertheless, the results are compelling. For 2022 this period extends from the close on 2022-08-24 through the close on 2022-09-08.

The chart below displays the cumulative $ gain/loss for unleaded gas futures only during this seasonally unfavorable period.

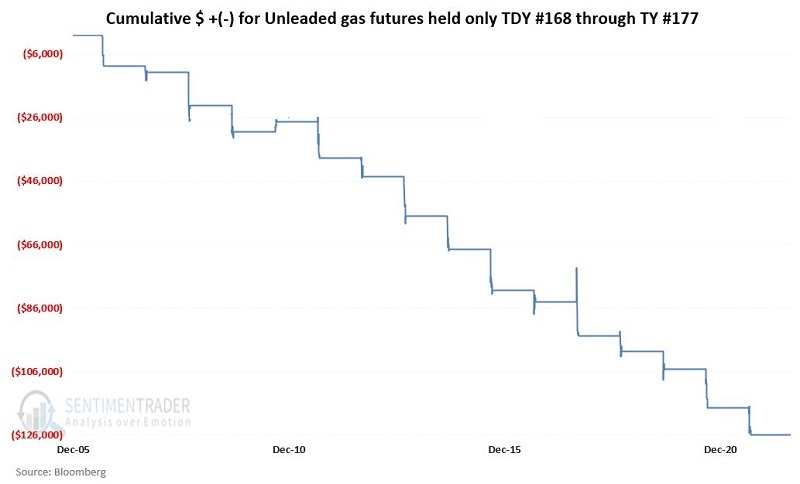
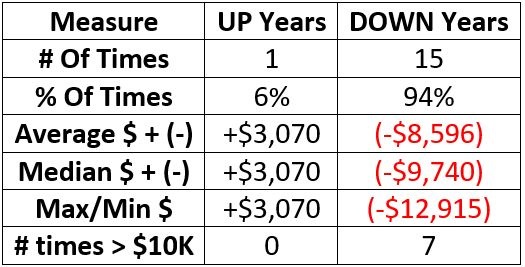
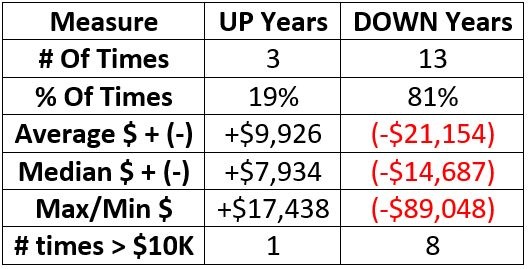
The table below presents a summary of performance during this seasonally unfavorable period. It is not a pretty picture.

Key period #2

Key period #2 simply extends key period #1 through TDY #226. For 2022 this period extends from the close on 2022-08-24 through the close on 2022-11-16.

The chart below displays the cumulative $ gain/loss for unleaded gas futures only during this seasonally unfavorable period.

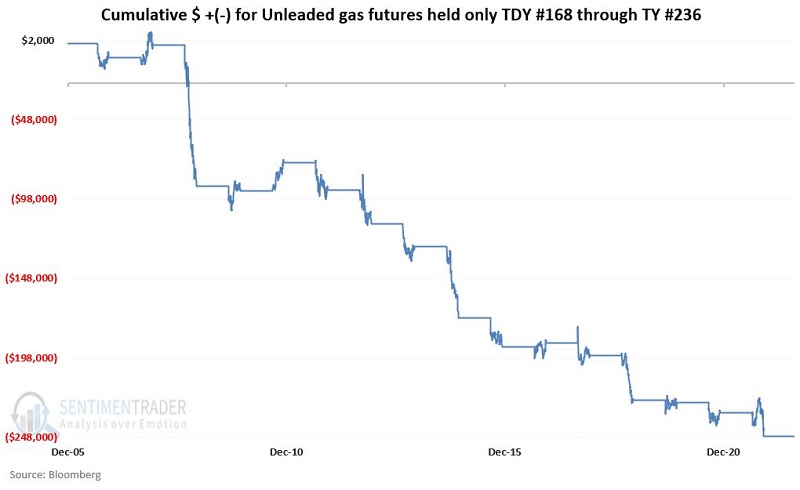
The table below presents a summary of performance. It is not a pretty picture.

A bullish twist

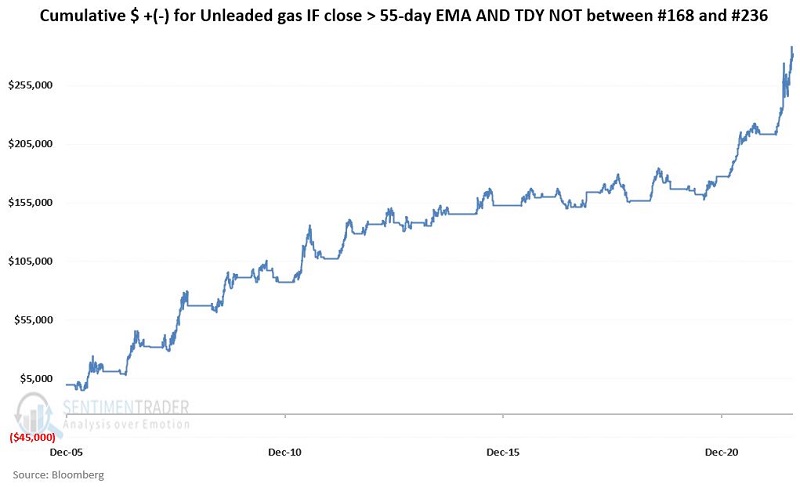
Let's look at those times when TDY is NOT between #168 and #236. We will give the bullish case the benefit of the doubt during these periods if price action is acting well. To rank price action as favorable or unfavorable, we will use a 55-day exponential moving average with a 1-day lag, i.e., if the price closes above the 55-day EMA on Friday's close, we will deem the following Tuesday (assuming no holiday on Monday) as favorable.

If a) the close the trading day before last was > 55-day EMA AND b) today is NOT Trading Day of Year #168 through #236, we will deem the trend favorable.

The table below displays the cumulative hypothetical $ + (-) for unleaded gas futures when a and b above are true.

What the research tells us…

A significant risk is always associated with relying solely on seasonality to trade. With even the most consistent seasonal trends, there is no guarantee that it will work the next time. That said, in the case of unleaded gas, history suggests, given the bearish case the benefit of the doubt in the months ahead - particularly if overall price action remains bearish.

PRODUCTS
SentimenTrader
Trading Tools
Indicators & Data API
‍
Strategies & Scanner
‍
Research Reports
FREE
RESOUrCES
Simple Backtest
Calculator
Simple Seasonality
Calculator
The Kelly Criterion
Calculator
Sentiment Geo Map
‍
Public Research Reports
‍
Education
Sentiment Indicators
‍
Technical Indicators
‍
Pricing
Bundle pricing
‍
FAQ
‍
Announcements
‍
COMPANY
‍
About
‍
In the News
‍
Testimonials
‍
Client Success Stories
CONTACT
‍
General Inquiries
‍
Media Inquiries
‍
Financial Professionals Inquiries
‍
© 2026 Sundial Capital Research Inc. All rights reserved.
Setsail Marketing
TermsPrivacyAffiliate Program
Risk Disclosure: The information and tools provided are for research and analytical purposes only and are not intended as investment advice. Market analysis involves uncertainty, and outcomes may differ from expectations. Users should conduct their own due diligence and consider their individual circumstances before making any financial decisions. Past performance is not necessarily indicative of future results.

Hypothetical Performance Disclosure: Hypothetical performance results have many inherent limitations, some of which are described below. No representation is being made that any account will or is likely to achieve profits or losses similar to those shown; in fact, there are frequently sharp differences between hypothetical performance results and the actual results subsequently achieved by any particular trading program. One of the limitations of hypothetical performance results is that they are generally prepared with the benefit of hindsight. In addition, hypothetical trading does not involve financial risk, and no hypothetical trading record can completely account for the impact of financial risk of actual trading. for example, the ability to withstand losses or to adhere to a particular trading program in spite of trading losses are material points which can also adversely affect actual trading results. There are numerous other factors related to the markets in general or to the implementation of any specific trading program which cannot be fully accounted for in the preparation of hypothetical performance results and all which can adversely affect trading results.

Testimonial Disclosure: Testimonials appearing on this website may not be representative of other clients or customers and is not a guarantee of future performance or success.