
Seasonality in regional banks

Key Points
- Regional banks tend to be highly cyclical in nature
- Below, we take an in-depth look at the annual seasonal trend for the SPDR S&P Regional Banking ETF (ticker KRE)
- The results are compelling (with the standard disclaimer that real-world trading is different than hypothetical backtesting)
A closer look at regional bank seasonality
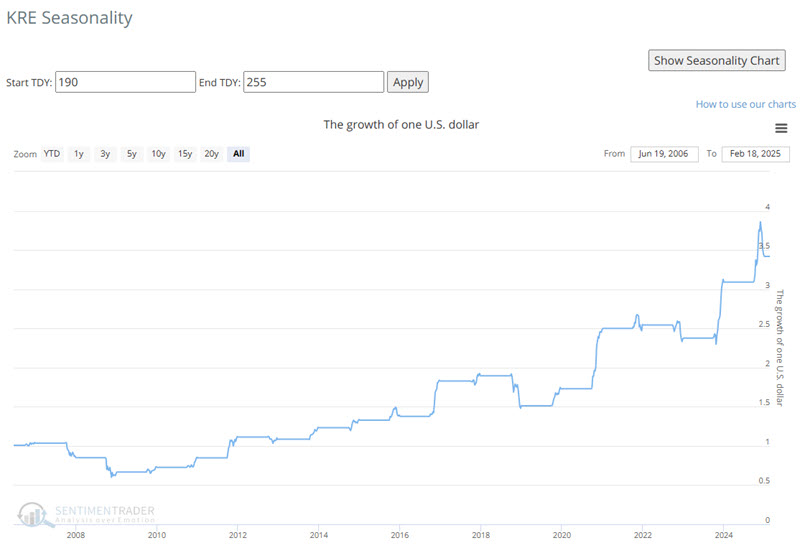
The chart below displays the annual seasonal trend for ??? (ticker KRE), which tracks an index of regional banks.
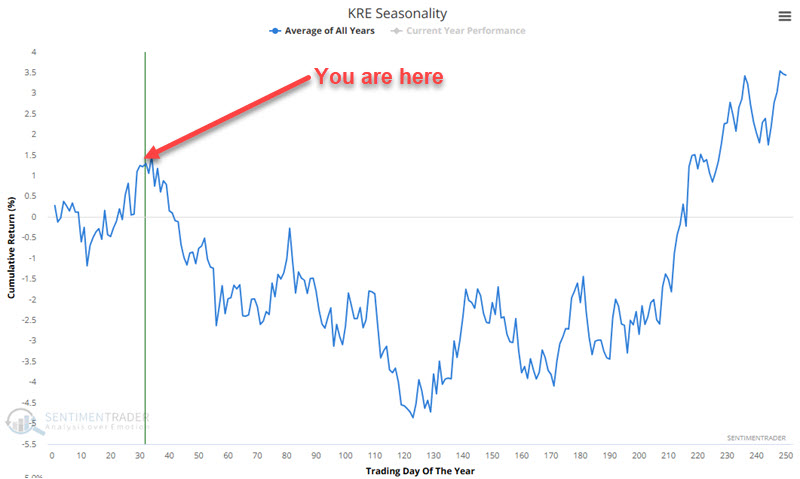
Let's break the chart above into "favorable" and "unfavorable" seasonal periods.
Period #1: Unfavorable - TDY #1 through #12
The chart below highlights the period from TDY #1 through TDY #12.
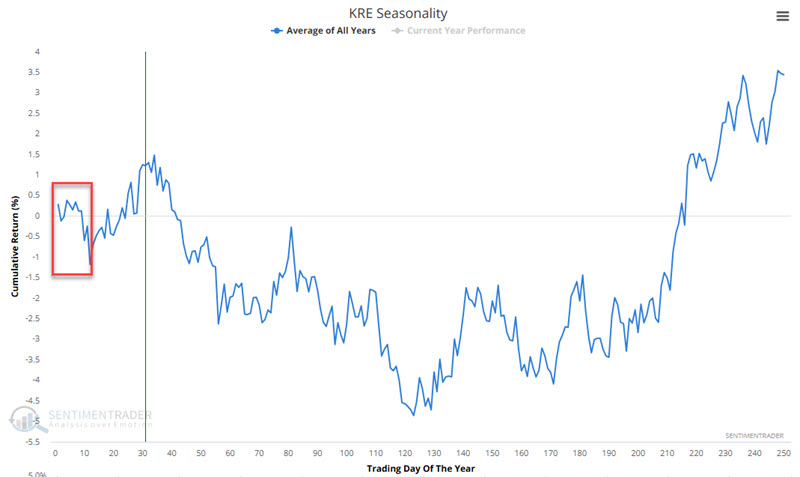
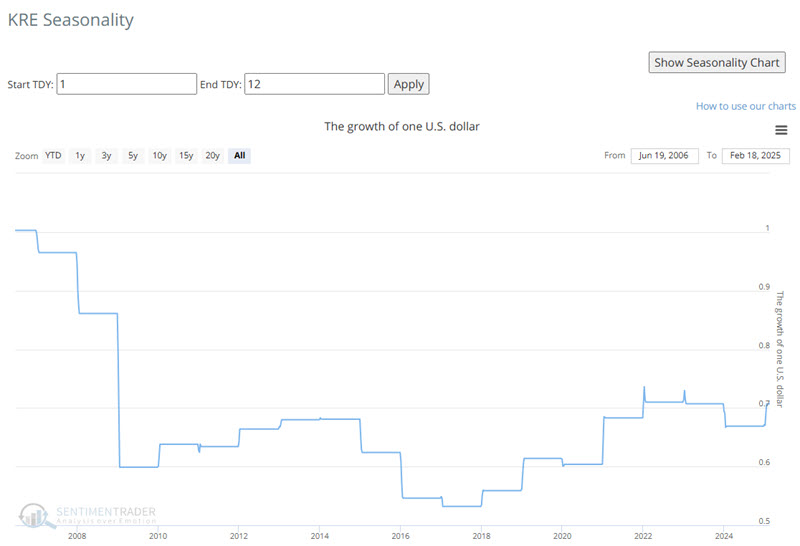
The table below displays the hypothetical growth of $1 invested in ticker KRE only during the abovementioned period.
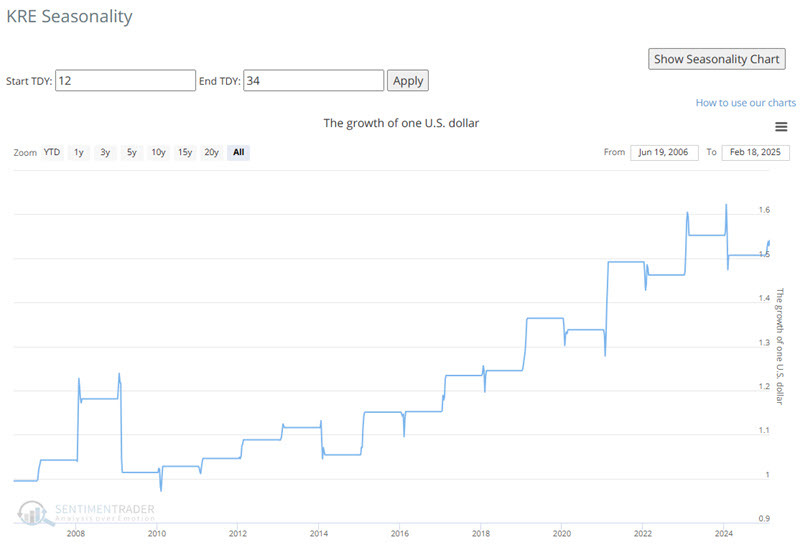
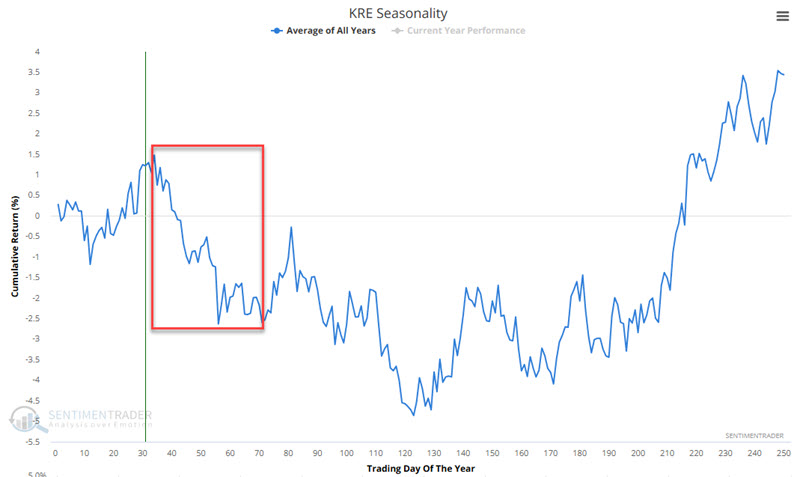
Period #2: Favorable - TDY #12 through #34
The chart below highlights the period from TDY #12 through TDY #34.
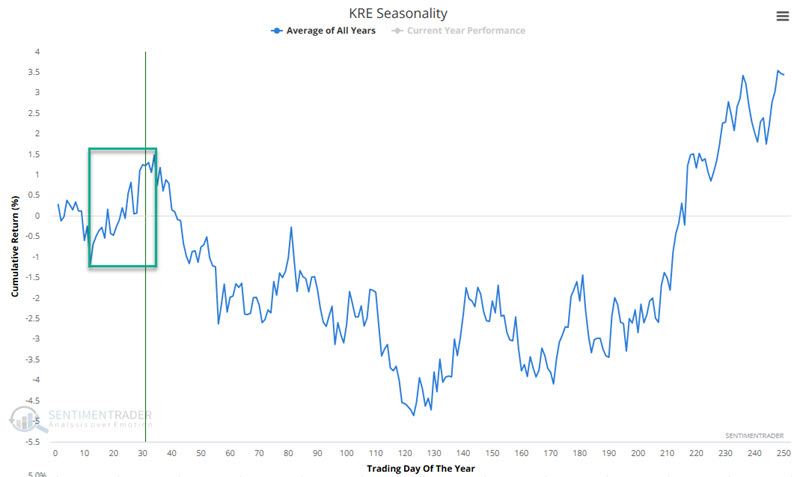
The table below displays the hypothetical growth of $1 invested in ticker KRE only during the abovementioned period.
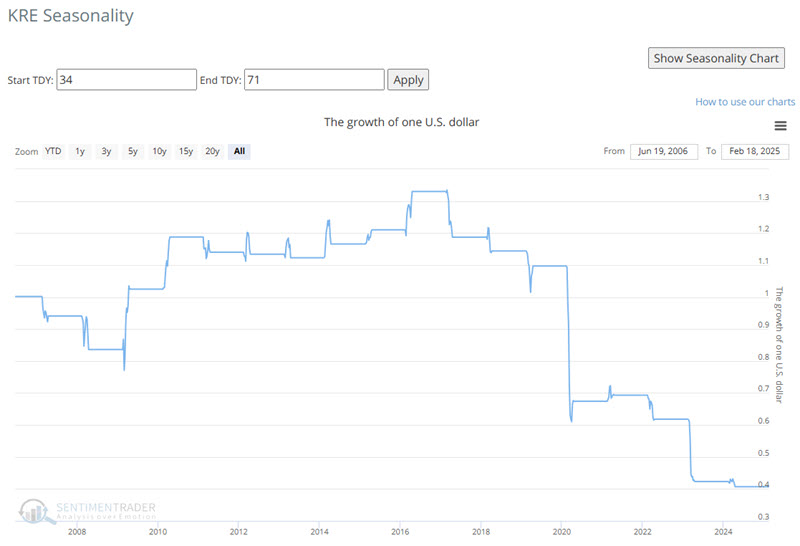
Period #3: Unfavorable - TDY #34 through TDY #71
The chart below highlights the period from TDY #34 through TDY #71.
The table below displays the hypothetical growth of $1 invested in ticker KRE only during the abovementioned period.
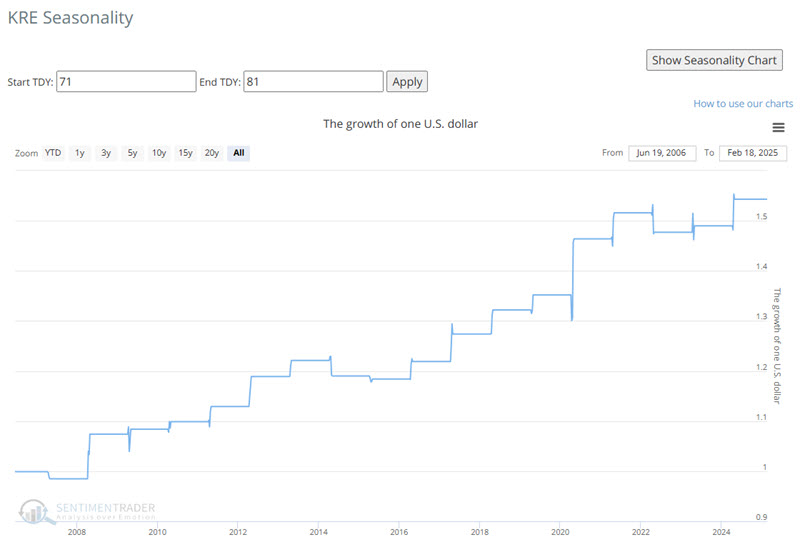
Period #4: Favorable - TDY #71 through TDY #81
The chart below highlights the period from TDY #71 through TDY #81.
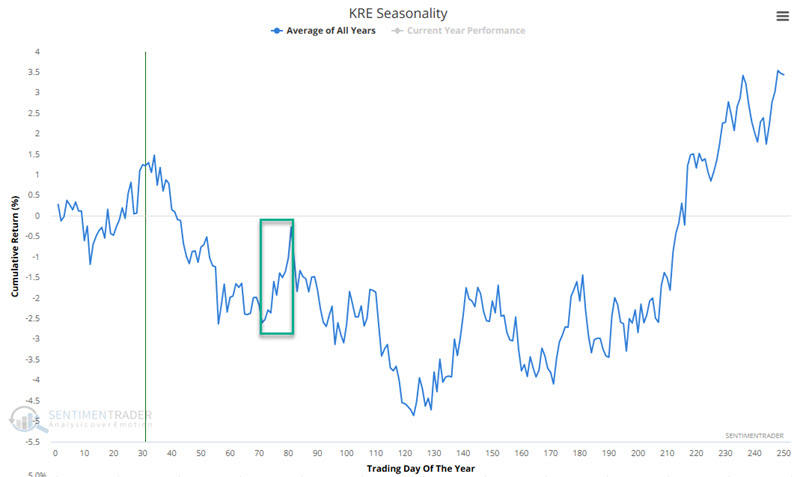
The table below displays the hypothetical growth of $1 invested in ticker KRE only during the abovementioned period.
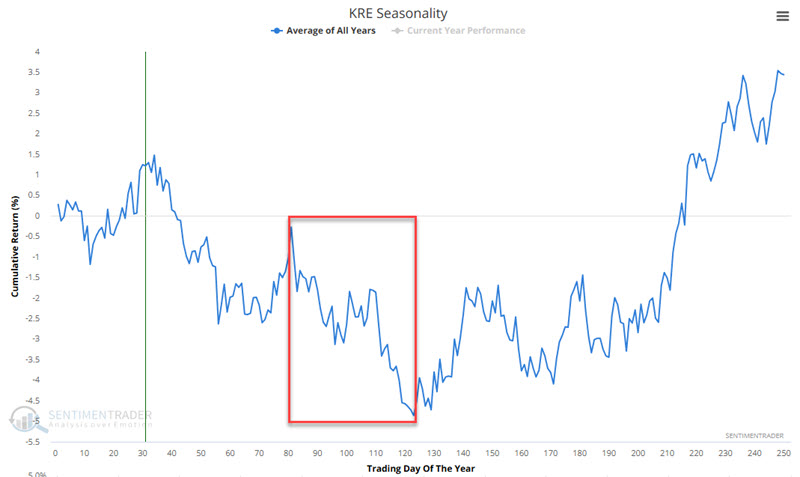
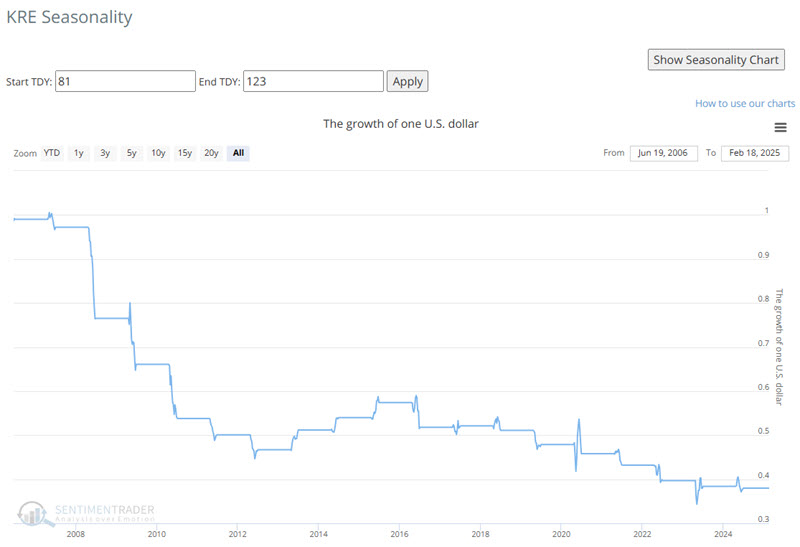
Period #5: Unfavorable - TDY #81 through #123
The chart below highlights the period from TDY #81 through TDY #123.
The table below displays the hypothetical growth of $1 invested in ticker KRE only during the abovementioned period.
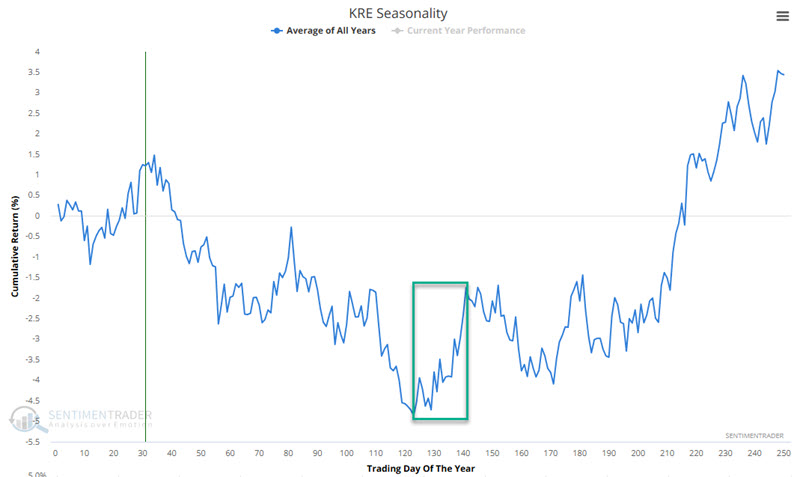
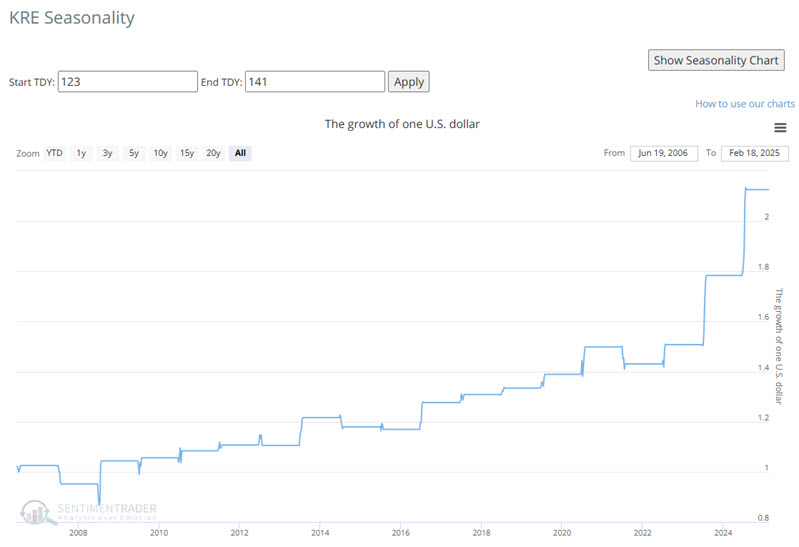
Period #6: Favorable - TDY #123 through TDY #141
The chart below highlights the period from TDY #123 through TDY #141.
The table below displays the hypothetical growth of $1 invested in ticker KRE only during the abovementioned period.
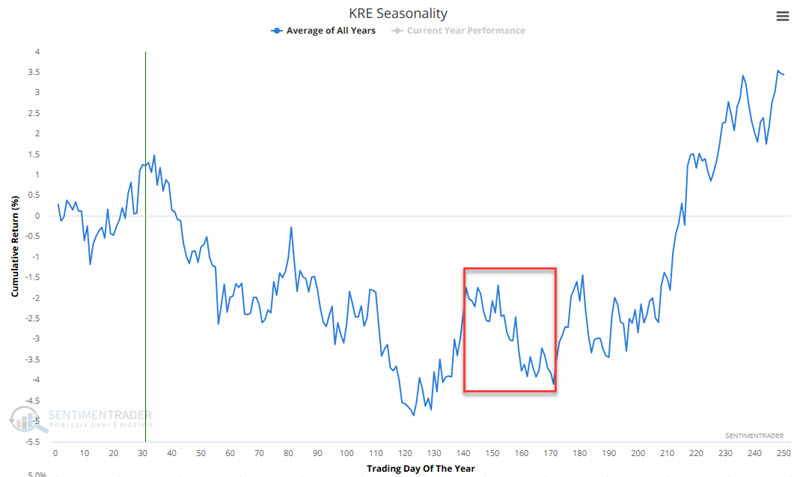
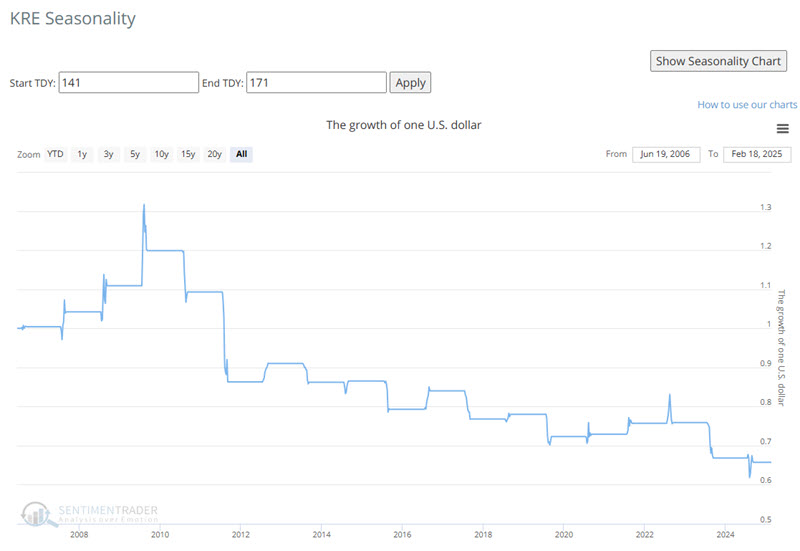
Period #7: Unfavorable - TDY #141 through TDY #171
The chart below highlights the period from TDY #141 through TDY #171.
The table below displays the hypothetical growth of $1 invested in ticker KRE only during the abovementioned period.
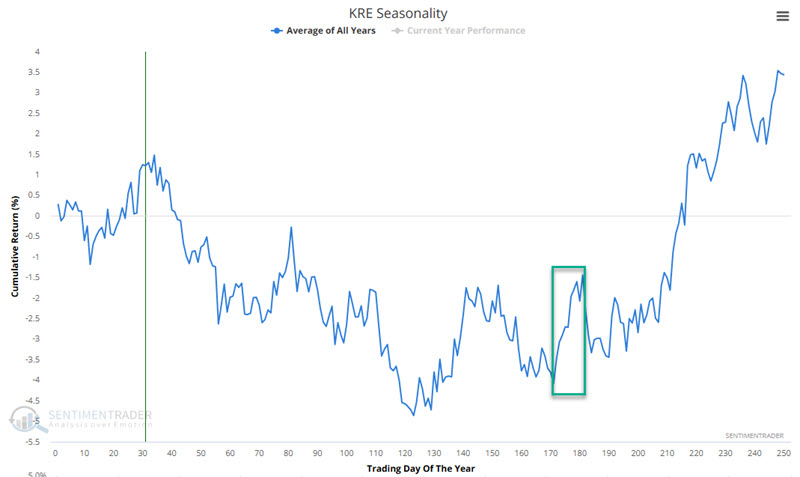
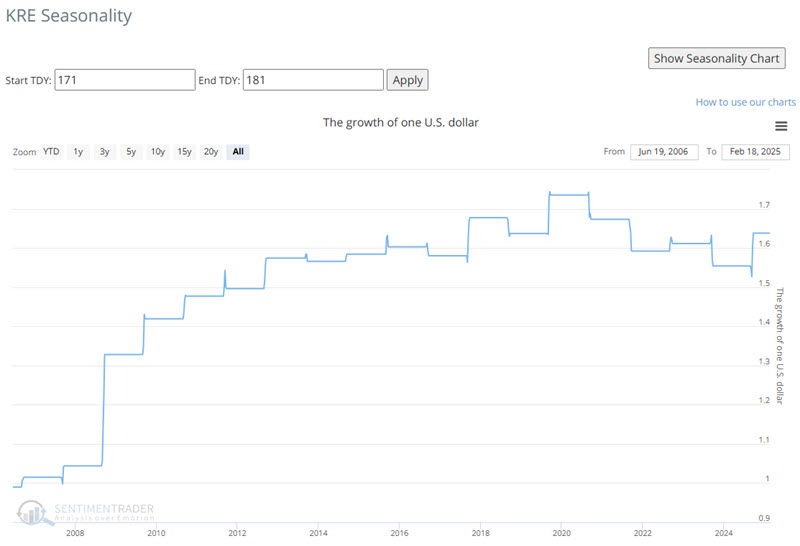
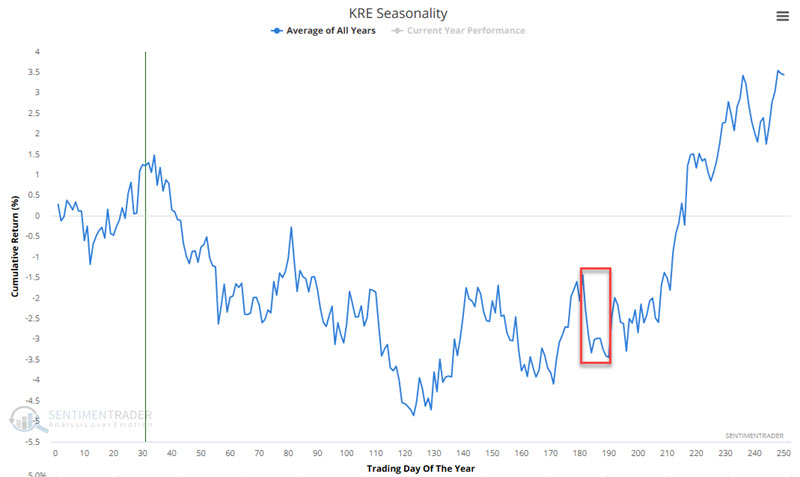
Period #8: Favorable - TDY #171 through TDY #181
The chart below highlights the period from TDY #171 through TDY #181.
The table below displays the hypothetical growth of $1 invested in ticker KRE only during the abovementioned period.
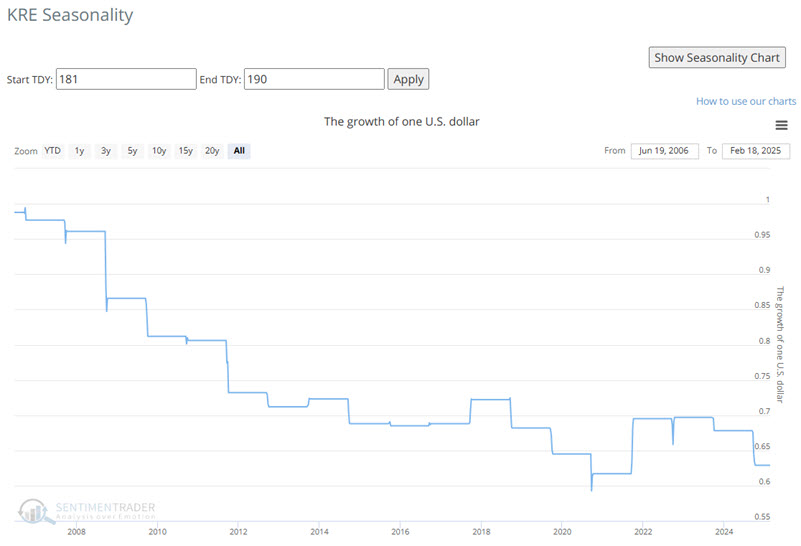
Period #9: Unfavorable - TDY #181 through TDY #190
The chart below highlights the period from TDY #181 through TDY #190.
The table below displays the hypothetical growth of $1 invested in ticker KRE only during the abovementioned period.
Period #10: Favorable - TDY #190 through TDY #255
The chart below highlights the period from TDY #190 through TDY #255.
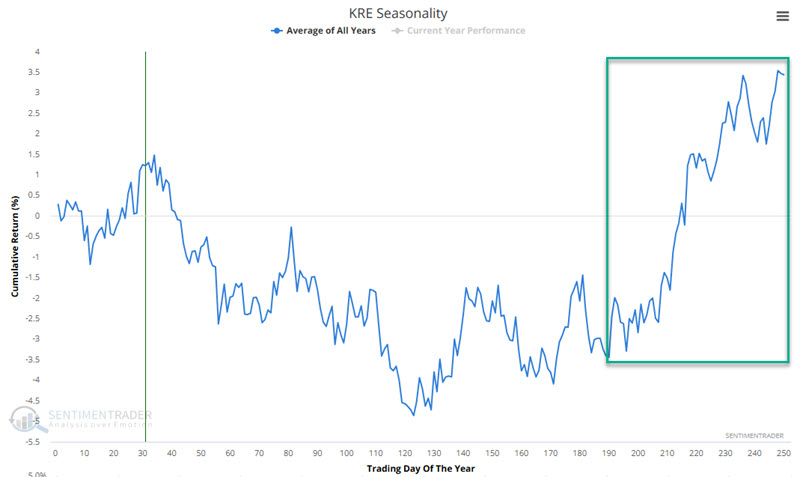
The table below displays the hypothetical growth of $1 invested in ticker KRE only during the abovementioned period.
Looking only at favorable periods
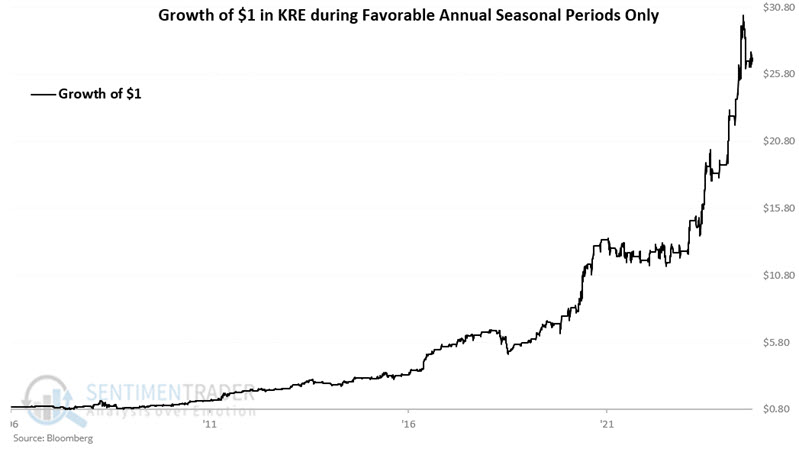
Now, let's combine all of the favorable periods highlighted above. For this test, we will assume that we hold ticker KRE every year only during favorable seasonal periods. The chart below displays the hypothetical growth of $1 using this approach. From 2006-06-22 through 2025-02-18, $1 grew to $27.03.
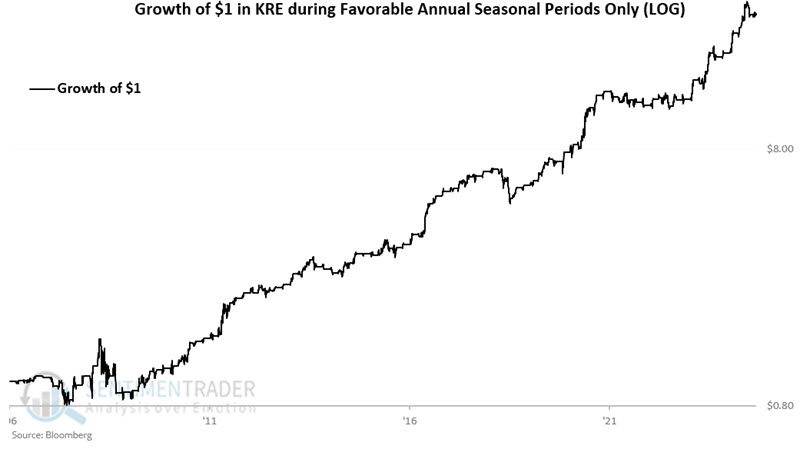
The chart below displays the same results on a logarithmic basis.
Looking only at unfavorable periods
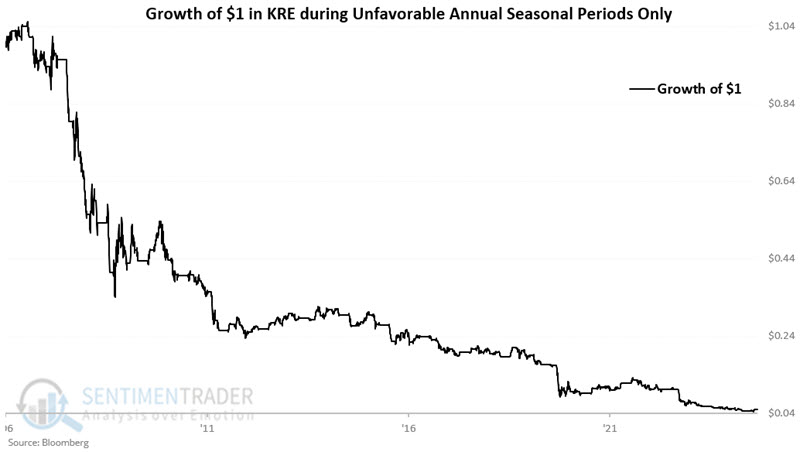
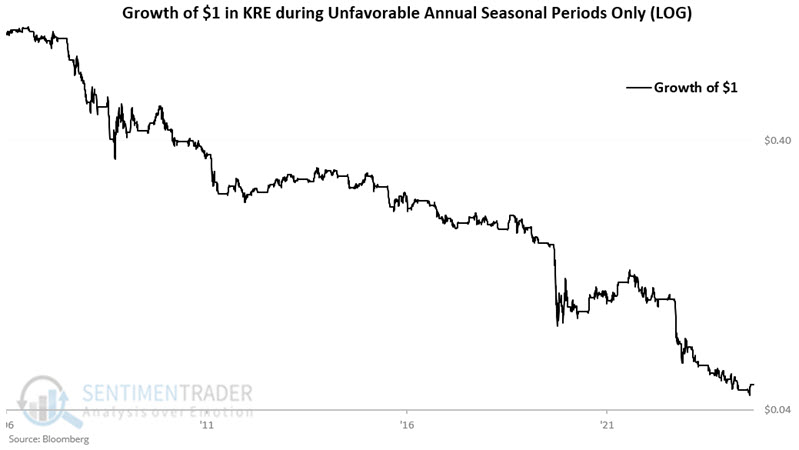
Next, let's combine all of the unfavorable periods highlighted above. For this test, we will assume that we only hold ticker KRE during unfavorable seasonal periods every year. The chart below displays the hypothetical growth of $1 using this approach. From 2006-06-22 through 2025-02-18, $1 shrank a shocking 95% to just $0.05.
The chart below displays the same results on a logarithmic basis.
Comparing favorable, unfavorable, and buy-and-hold
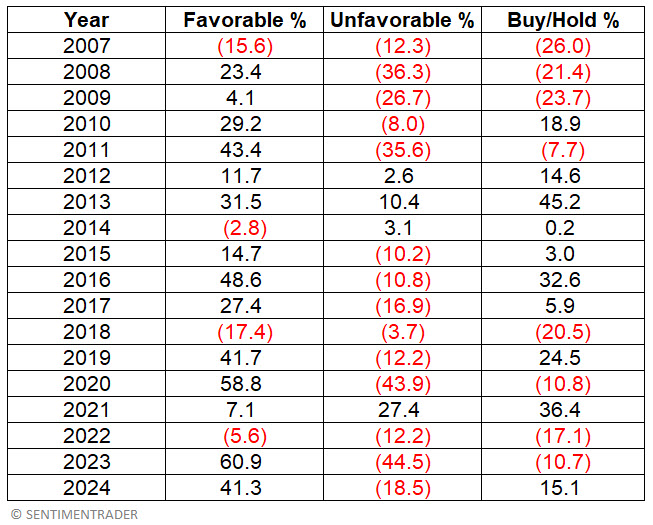
The table below displays the hypothetical annual results for holding KRE during favorable versus unfavorable periods and for a buy-and-hold approach.
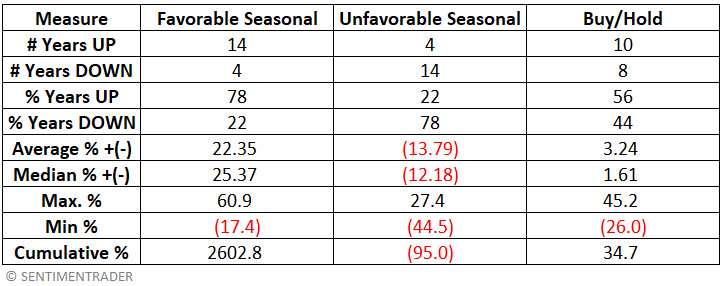
The table below summarizes the performance for each category.
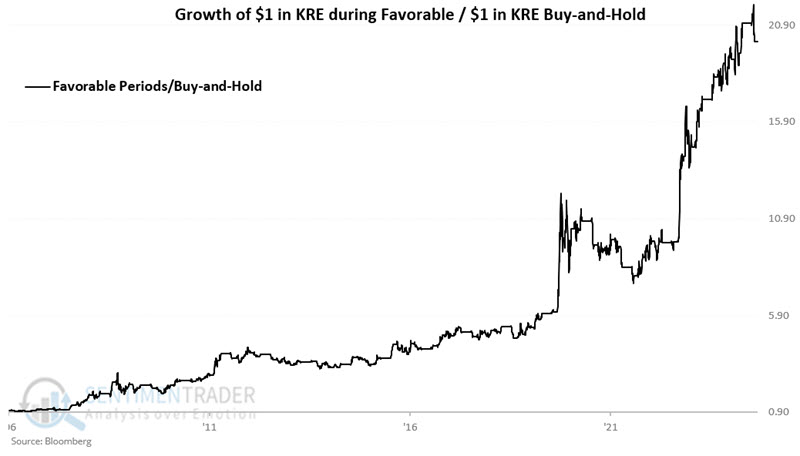
The chart below displays the growth of $1 in KRE only during favorable periods relative to $1 invested in KRE on a buy-and-hold basis.
At this point, the prospect of holding KRE only during favorable seasonal periods might look pretty compelling. But before anyone gets stars in their eyes, consider the chart below, which shows the maximum drawdowns experienced by holding KRE only during favorable seasonal periods.
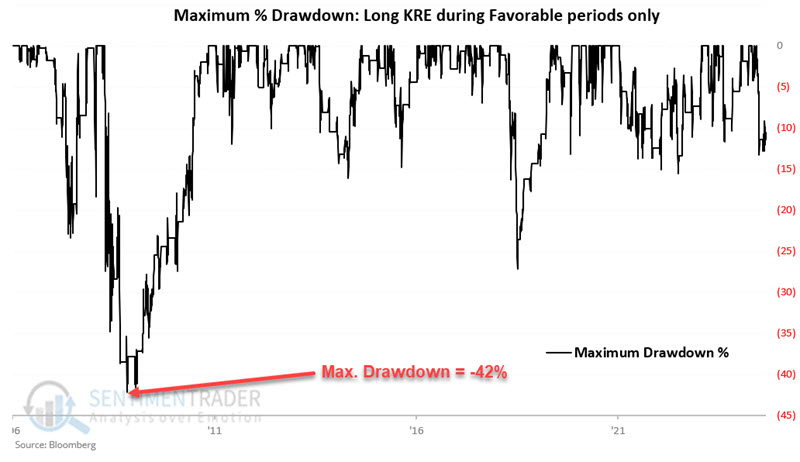
The reality is that a -42% drawdown is nothing to sneeze at. This "strategy" also suffered a -26% drawdown in 2018. So, applying this strategy in real-time with real money should not be confused with or thought of as "easy money."
Calendar for 2025
For a trader interested in tracking the above, the table below displays the seasonal "calendar" for ticker KRE for 2025.
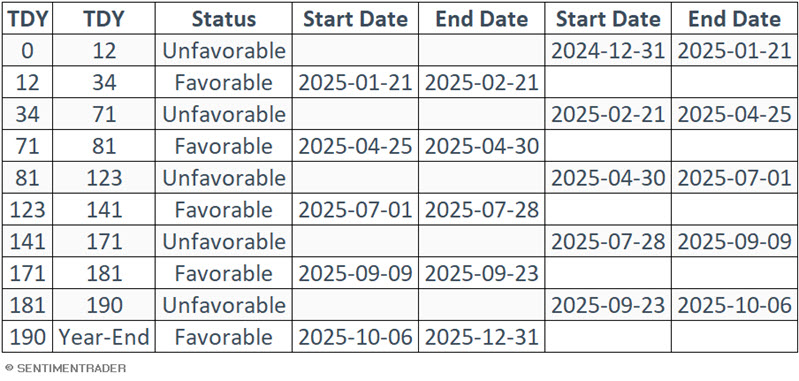
Note that the next status change will occur at the close of 2025-02-21 when the status changes from Favorable to Unfavorable. It will remain Unfavorable through the close on 2025-04-25.
What the research tells us...
The regional bank sector has a history of concentrating advances during certain times of the year and declines during other times. The disparity in historical regional bank performance during Favorable versus Unfavorable periods is compelling and does appear to offer an "edge" to traders. Should seasonality be used as a mechanical standalone trading strategy? That is a question for each trader to answer for themselves.