
Seasonality a potential ray of hope for plummeting natural gas

Key Points
- In early December and again in early January, I wrote about an unfavorable seasonal period for Natural gas
- Natural gas has plunged over -30% in just the last month
- The seasonal trend is about to reverse from unfavorable to favorable
An overview of trading seasonality
The most important thing to remember about seasonality is that it is simply an average of what has happened in the past - it is NOT a roadmap for what will happen this year. My favorite way to explain it is that it "tells you when to look in which direction." But using seasonality as an "automated" buy or sell signal generator is perilous - particularly when it runs counter to a market trending sharply in the other direction. In simplest terms:
"If seasonality and price trend (however a given trader defines "trend") align, there is opportunity."
When a historically favorable (or unfavorable) seasonal period begins, a trader who wants to play this potentially advantageous period is typically best advised to either:
- Look for price action to be trending in the expected direction (price in an uptrend if entering a favorable seasonal period or price in a downtrend if entering an unfavorable seasonal period)
- Look for an upside reversal from a deeply oversold market (which is theoretically "due for a bounce) in the case of a new favorable seasonal trend or for a downside reversal from a sharply overbought market in the case of a new unfavorable seasonal trend
But what if neither of the above exists at the start of a new seasonal period? In that case, a trader may be wise to hold off on taking a position and wait for some sign of price confirmation to develop (using their preferred trend confirmation method). Again, seasonality is not a magic trick nor anywhere near a "sure thing." It is merely an indicator; like all indicators, it will experience good and bad signals.
The danger in waiting for confirmation is that a significant portion of a seasonal price move might be missed. Conversely, the risk of buying into an oversold market at the outset of a favorable seasonal period is that the market could continue to trade sharply lower. A solid, objective risk management plan is essential to avoid a significant loss in such a scenario.
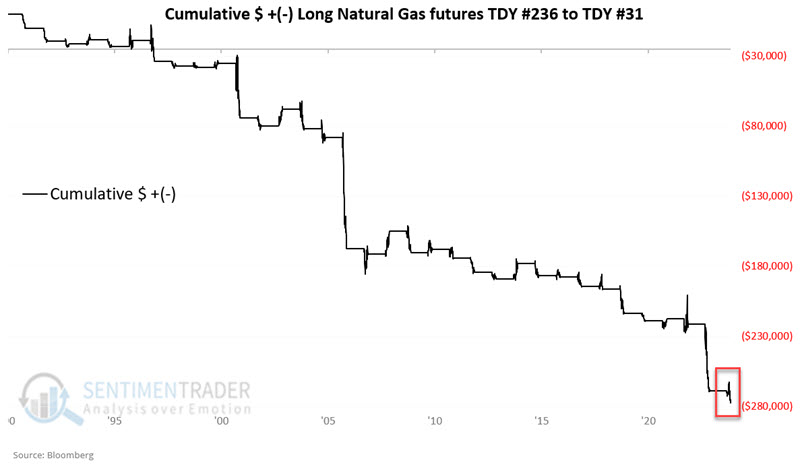
Unfavorable seasonal period ultimately played out in spades in natural gas
In early December and again in early January, we warned of an unfavorable seasonal trend for natural gas. Natty rallied in December but plunged a stunning 30+% in the past month.
The chart below displays the cumulative hypothetical $ + (-) for a long position in natural gas futures during this unfavorable seasonal period (TDY #236 to TDY #31 the following year) that will be ending soon (highlighted in red box).
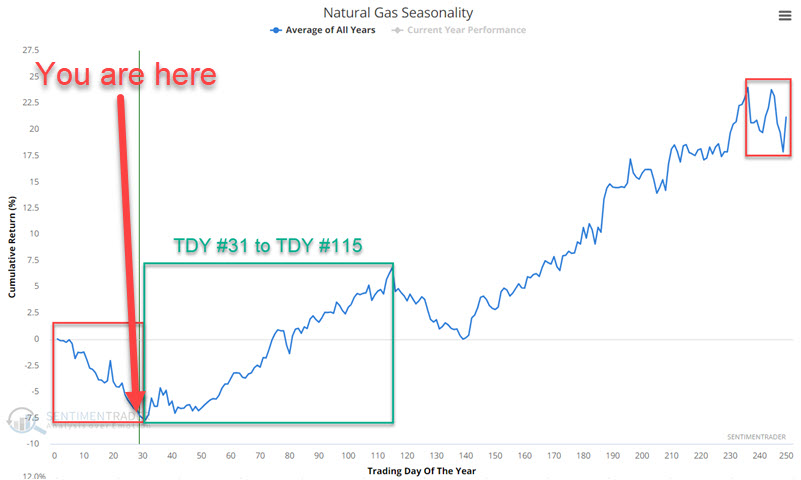
A favorable seasonal period is soon to start
The chart below displays the annual seasonal trend for natural gas. The green box highlights the period from Trading Day of Year (TDY) #31 throu, h TDY #115 since 1990 when natural gas futures started trading. For 2024, this period extends from the close on 2024-02-13 through the close on 2024-06-10.
The chart below shows the hypothetical cumulative gain from holding a long position in natural gas futures during this period each year since 1990.
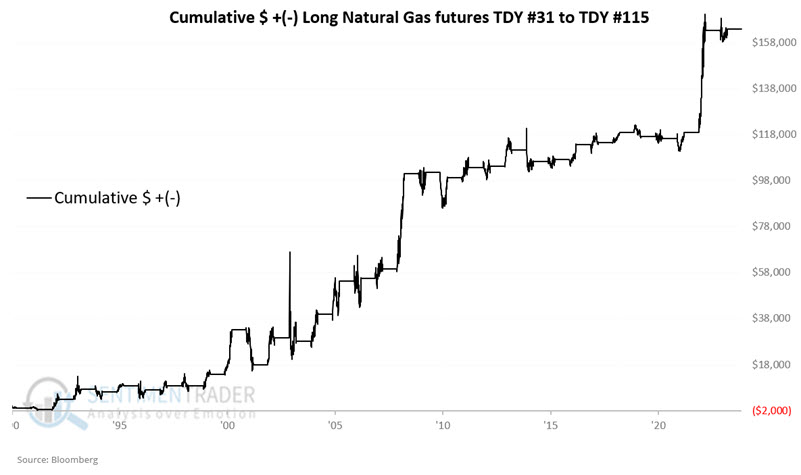
The table below summarizes natural gas performance during this period.
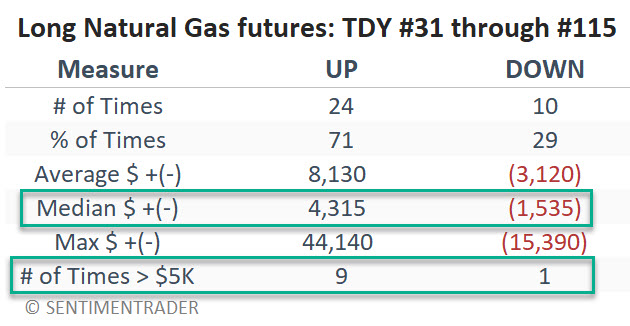
The good news is that historical results skew heavily to the favorable side (71% Win Rate, a median gain of +$4,315 versus a median loss of -$1,535, and $5K returns skew 9 to 1 to the upside). The bad news is losses of -$15,390 in 200, and -$5,050 in 2014, and a 71% Win Rate implies three losing periods in any ten years.
The bottom line: Deep pockets are required to trade natural gas futures and traders are encouraged to combine seasonality with their own favorite trend or price action confirmation method rather than relying solely on seasonality.
A word of caution for ETF traders
In many cases, non-futures traders can now gain exposure to a given commodity using ETFs. And there is a heavily traded ETF that tracks natural gas futures. That ETF is the United States Natural Gas Fund LP (ticker UNG). Unfortunately, in this case, trading UNG may not be helpful. This is due to a situation known as "contango." A futures market is said to be in contango if the price of a futures contract that expires sooner is less than that of a later expiring future contract. This has been a constant in the natural gas market for several years. Prevailing contango can gradually erode the value of UNGs' assets by forcing it to pay incrementally more to roll forward expiring futures contracts month after month. This can result in an ETF with a long-term price trend biased to the downside (ticker VXX is another example). This may or may not fully explain the following:
Natural gas futures have enjoyed overall favorable performance during the TDY #31 to TDY #115 period over the years, but the same cannot be said for ticker UNG. The chart below displays the growth of $1 invested in ticker UNG during this period every year since 2007 when UNG started trading.
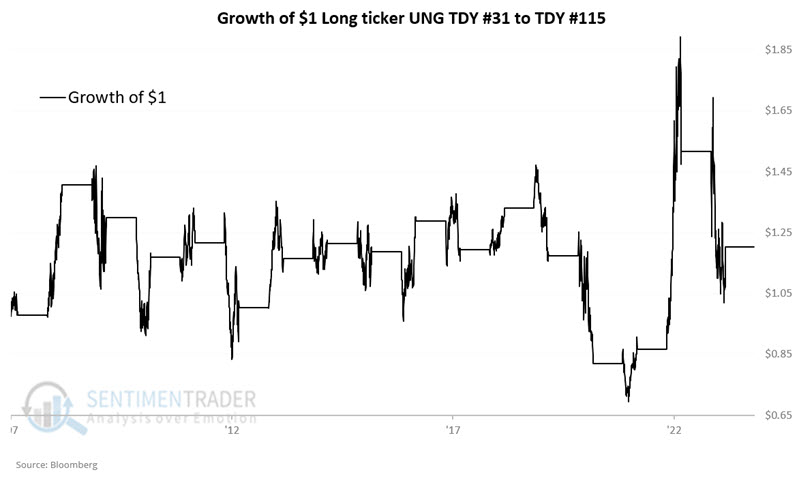
Not very inspiring. The table below summarizes UNG's performance during this theoretically favorable seasonal period.
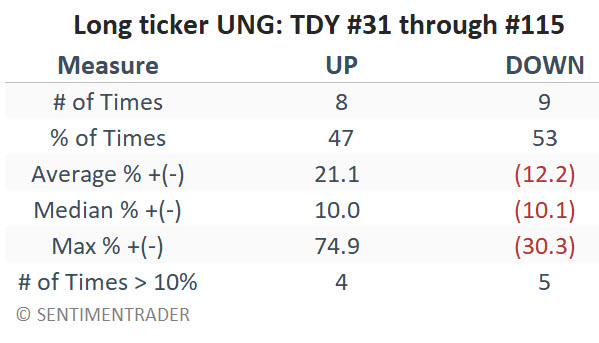
There have been some huge winners (+74.9% in 2022 and +43.8% in 2008) but also some significant losses (-30.3% in 2020 and -20.7% in 2023). The Win Rate is an extremely uncompelling 47%. One suggestion might be to wait for UNG to close above a 150-day exponential moving average before considering a long position. The chart below displays the growth of $1 invested in UNG during TDY #31 through TDY #115, depending on whether the price is above or below the 150-day exponential moving average.
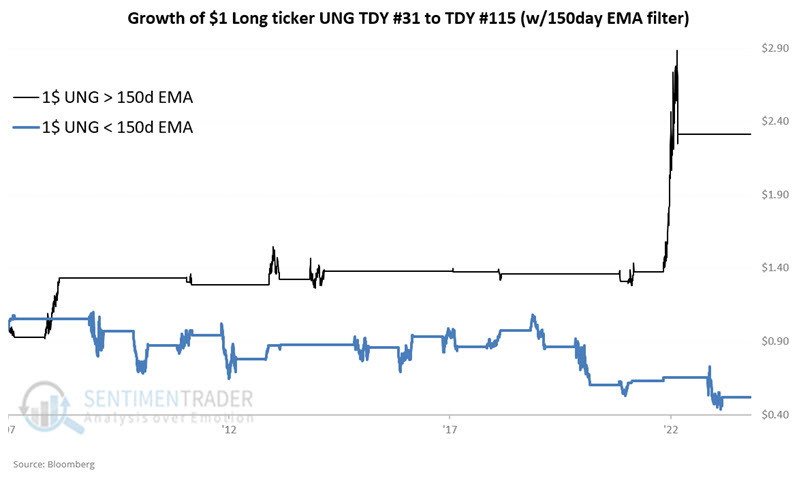
Most of the gains using the 150-day EMA as a filter occurred in just two calendar years - 2008 and 2002.
What the research tells us...
Natural gas has historically proven to be a highly cyclical market, with typically lower prices from early winter into mid-winter and higher prices from mid-winter to late spring. But as always, no seasonal trend is guaranteed to work the next time around. As a result, we generally recommend using seasonal trends to tell us "When to look in which direction" and applying some price trend filter to confirm that price is actually doing what it "should" be doing. While natural gas futures are presently in a vicious declining trend, futures traders should be alert for a potential reversal and stand prepared to take advantage - while remaining wary of trying to "catch a falling safe." On the other hand, ETF traders should likely wait for some explicit price trend confirmation before diving into a long position in ticker UNG.