
Seasonal trends to keep an eye on

Key Points
- Coffee, Corn, U.S. Dollar, and Wheat have all recently established an obvious line of price resistance
- Each of these markets is soon to enter a seasonally unfavorable period
- Traders in these markets should be very alert to the potential for a sharp downside reversal in the weeks and months ahead
- That said, if a market breaks out to the upside, traders should also be ready to "walk away" from short positions
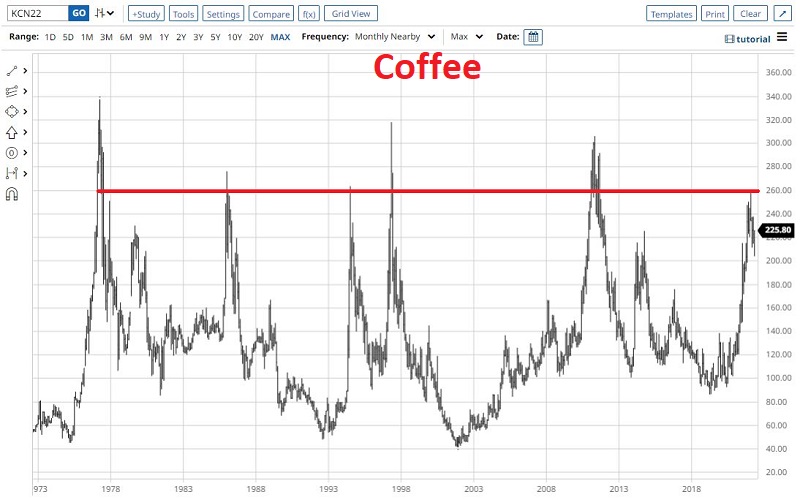
Coffee
The chart below (courtesy of StockCharts.com) displays a long-term chart for coffee futures and a relevant price resistance line.
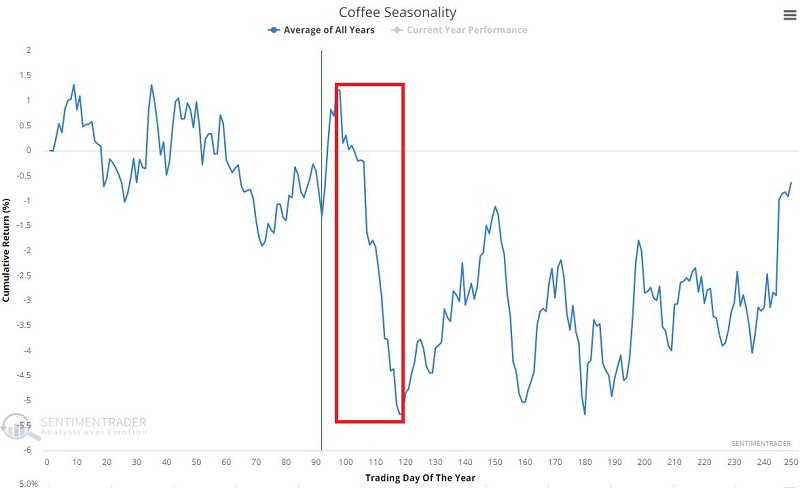
The chart below displays the annual seasonal trend for coffee futures. Note the impending period of seasonal weakness. For 2022 this period extends from the close on 5/20 through the close on 6/21.
The chart below displays the hypothetical $ +(-) achieved by holding a long position in coffee futures only during this period every year since 1973.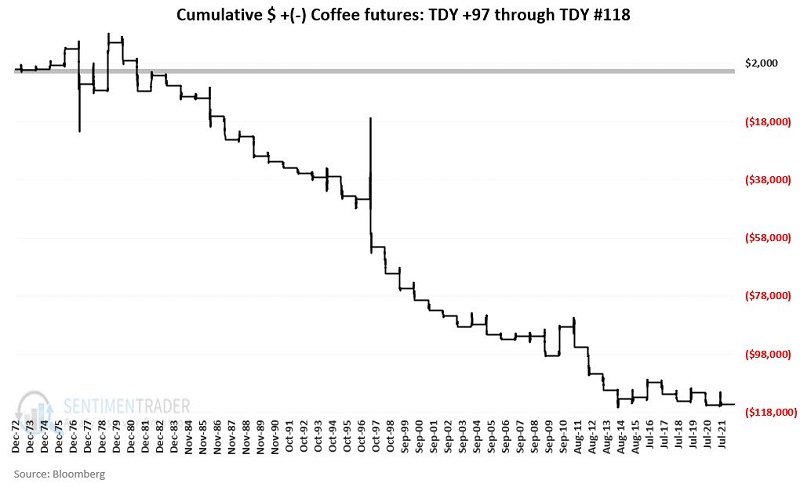
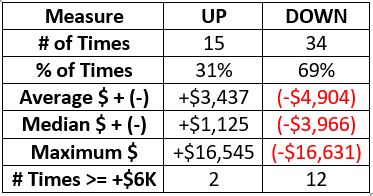
The table below displays a summary of the results.
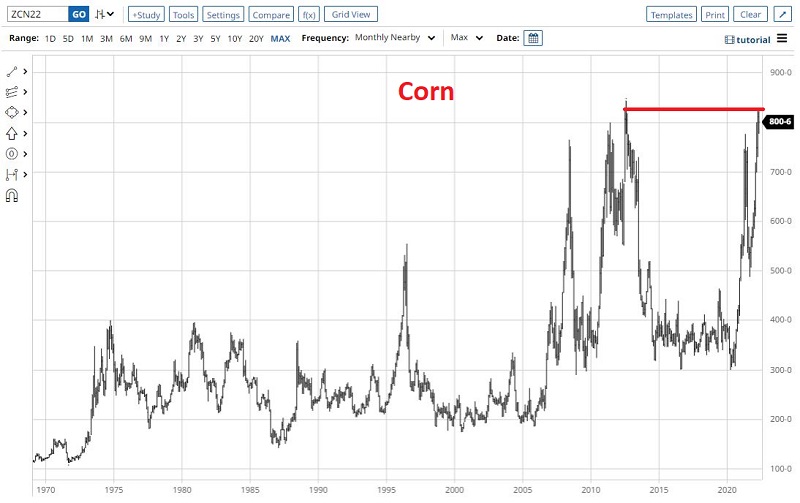
Corn
The chart below displays a long-term chart for corn futures and a relevant price resistance line.
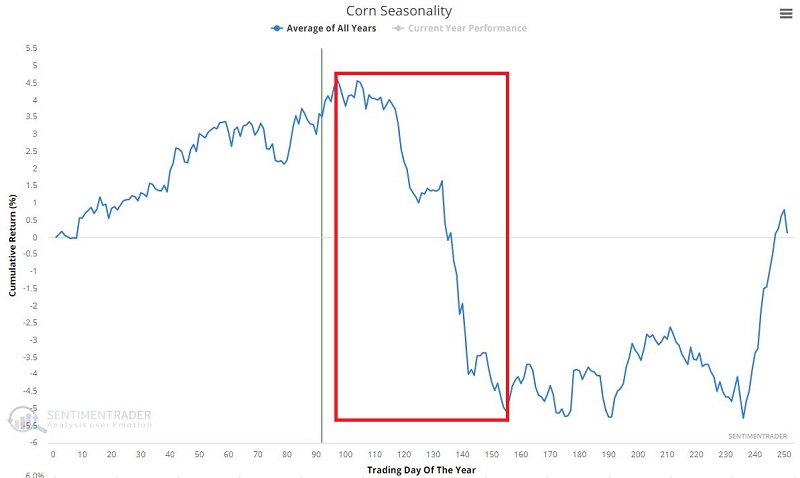
The chart below displays the annual seasonal trend for coffee futures. Note the impending period of seasonal weakness. For 2022 this period extends from the close on 5/20 through the close on 8/12.
The chart below displays the hypothetical $ +(-) achieved by holding a long position in corn futures only during this period every year since 1950.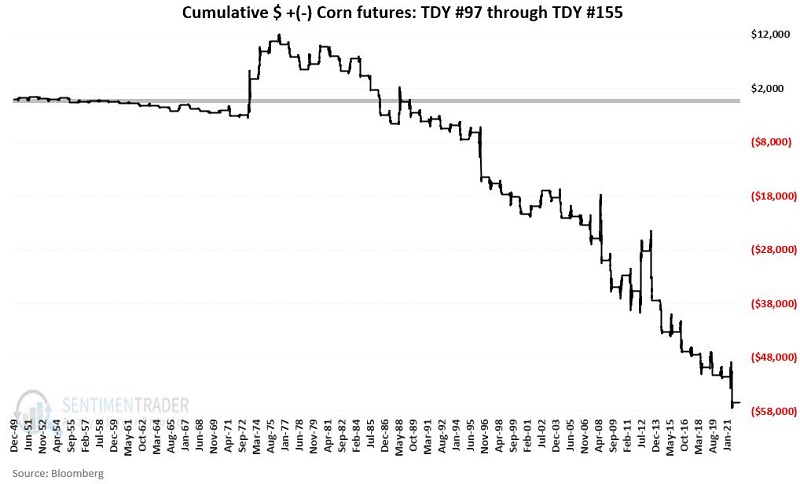
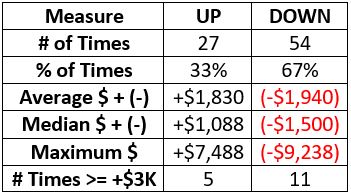
The table below displays a summary of the results.
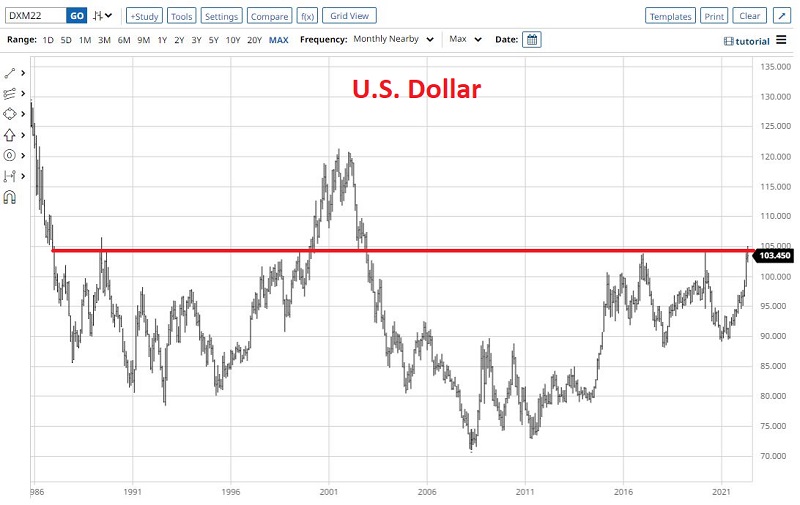
U.S. Dollar
The chart below displays a long-term chart for U.S. Dollar futures and a relevant price resistance line.
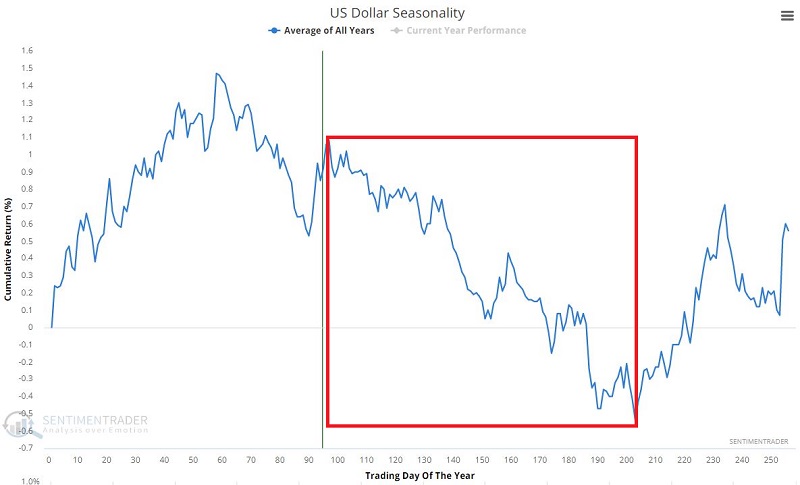
The chart below displays the annual seasonal trend for coffee futures. Note the impending period of seasonal weakness. For 2022 this period extends from the close on 5/18 through the close on 8/18.
The chart below displays the hypothetical $ +(-) achieved by holding a long position in U.S. Dollar futures only during this period every year since 1985.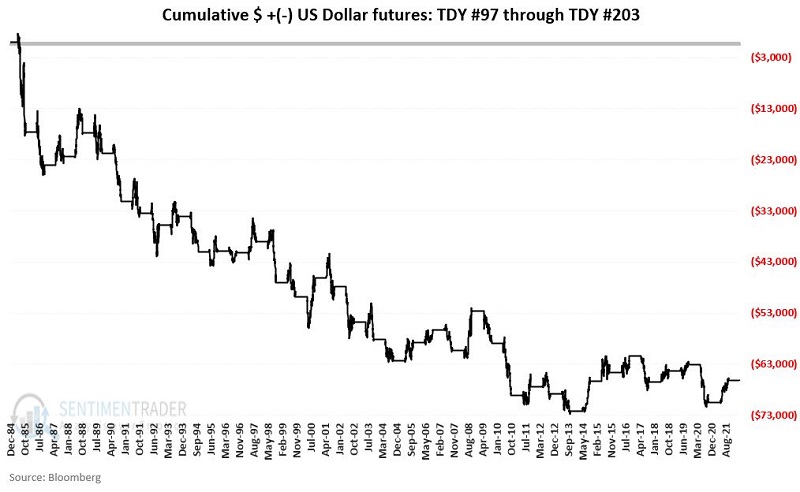
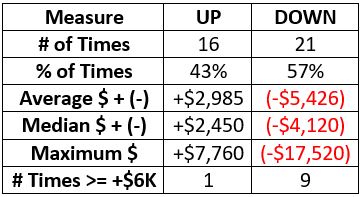
The table below displays a summary of the results.
Wheat
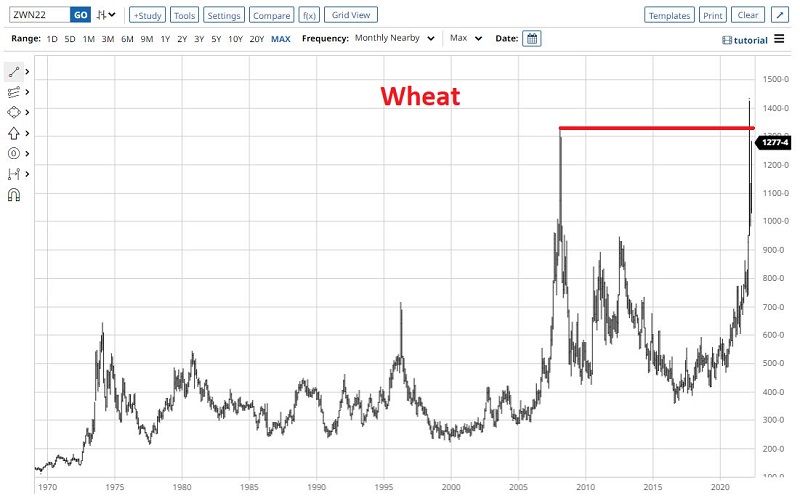
The chart below displays a long-term chart for wheat futures and a relevant price resistance line.
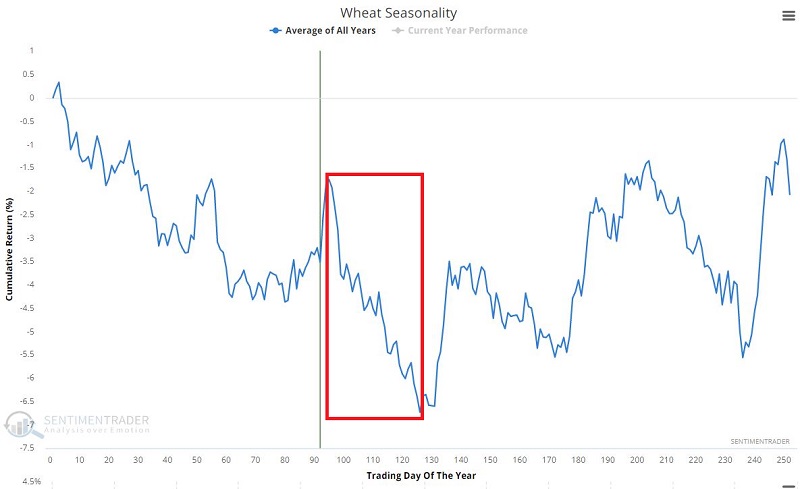
The chart below displays the annual seasonal trend for wheat futures. Note the impending period of seasonal weakness. For 2022 this period extends from the close on 5/18 through the closing on 7/1.
The chart below displays the hypothetical $ +(-) achieved by holding a long position in wheat futures only during this period every year since 1935.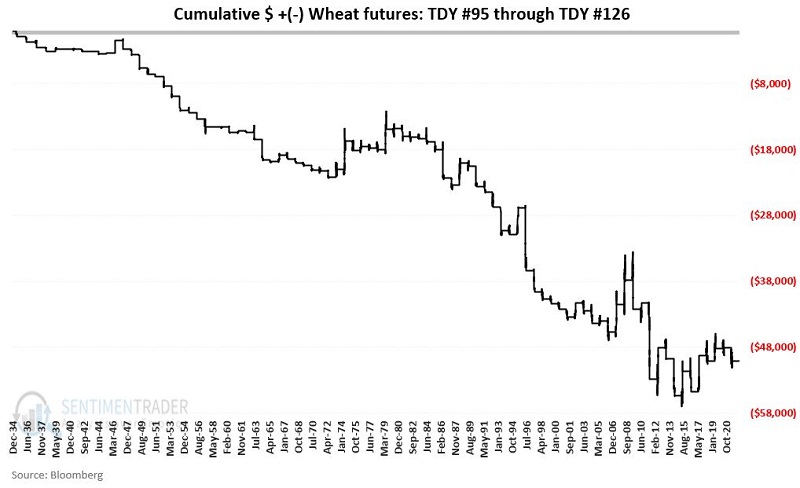
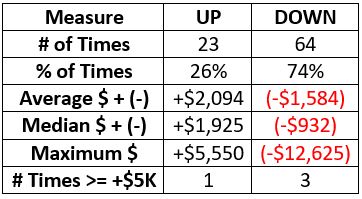
The table below displays a summary of the results.
What the research tells us…
The "obvious" play for each of the markets highlighted above is to look to play the short side during the seasonally unfavorable period as long as the price remains below the indicated resistance level. The most important keys are to a) make sure the dollar risk between any short entry price and a stop-loss price above resistance is within a trader's tolerance for risk and b) resolve to exit the trade if resistance is pierced and not wait around "hoping" for a reversal.
One other item to note is that if many of these markets do break out to the upside, the implication would be that a high level of inflation is likely to persist for some time. So even if one chooses not to trade these markets, they may be worth keeping an eye on for the knowledge that they may impart.