
Seasonal trends that may point the way

Key Points
- Bonds may be nearing a "now or never" moment if they are going to stage a rebound
- Corn is nearing its weakest seasonal period of the year - and sentiment may soon reach a negative tipping point
- Natural gas will also enter a weak seasonal period soon - with sentiment already showing an extreme reading
Treasury Bonds
As I detailed here, I believe the "game has changed" regarding bonds as we are (I think) in the early stages of a new rising rate environment that may last for years. As a result, many "things" that worked in bonds over the past 40 years may not be as effective in the future. For the moment, I am giving the benefit of the doubt to the annual seasonal trend you see below for 30-year treasuries.
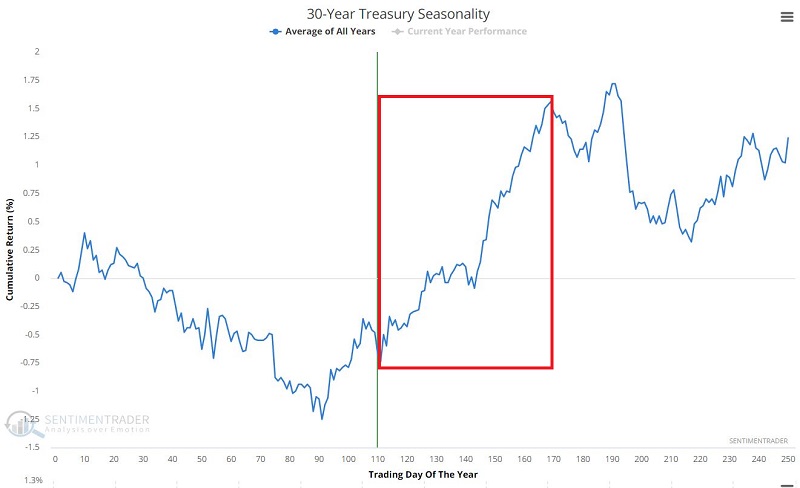
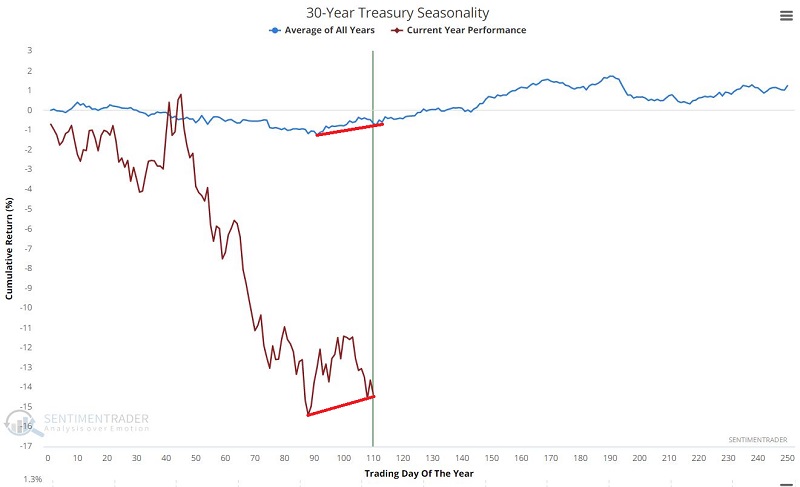
The bottom line is that if t-bonds are going to bounce and stage some sort of rally, we are getting close to "now or never" time. The wisdom in buying and holding long-term treasuries to lock in a 3% annual return for the next 30 years (particularly amid 8%+ inflation) is an open question. But shorter-term traders looking to play the long side of a "bounce" should be paying close attention. The chart below gives a sense of how badly below average this year has been for bonds. It also highlights a potential sign of waning downside momentum.
Corn
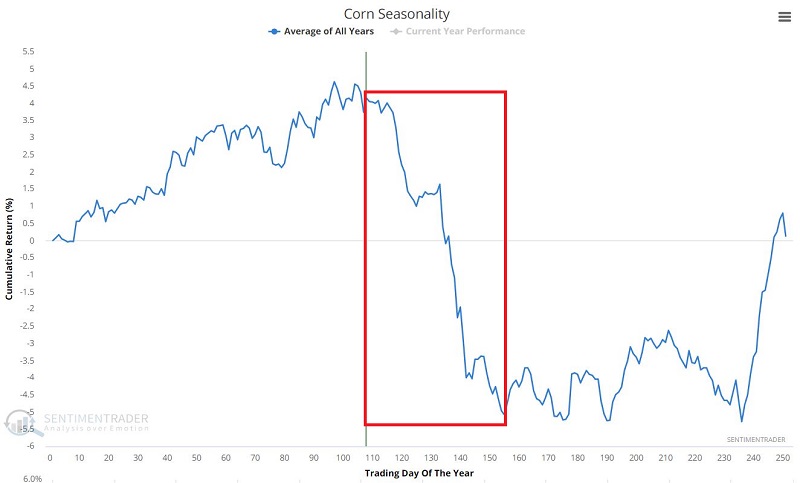
Corn has enjoyed a terrific run in the last two years. In light of high inflation and crop uncertainty around the globe, there is a possibility that prices will continue to run higher. However, seasonality and sentiment suggest that caution may be in order very soon. As you can see in the chart below, corn tends to experience significant weakness between early June and roughly the middle of August.
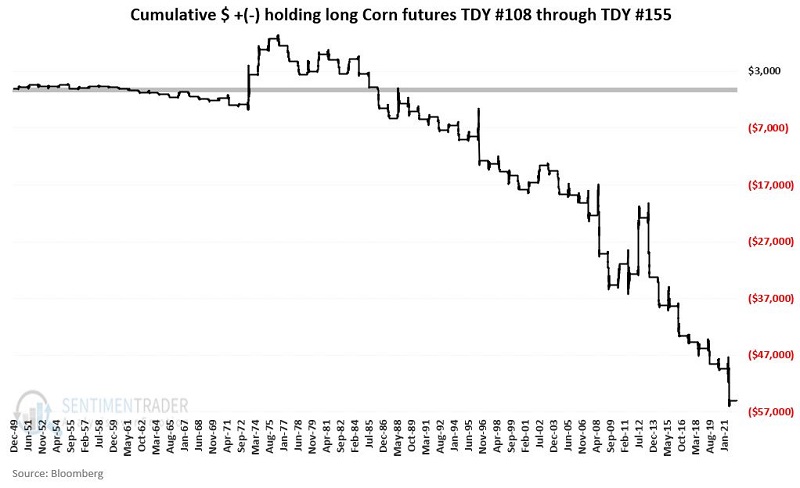
The chart below displays the $ +(-) from holding a long position in corn futures from Trading Day of the Year #108 through TDY #155 since 1950. The overall downward bias is hard to miss. Unfortunately, a "downward bias" does not guarantee a seasonal decline this year.
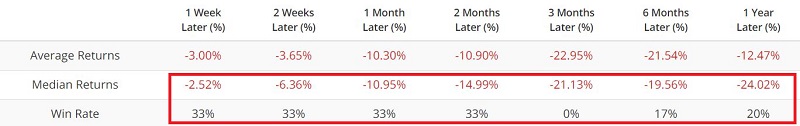
The chart and table below highlight those times when the 100-day average for Corn Optix dropped below 72. A new signal may be forming in the next several weeks if daily Corn Optix continues to taper off as it has been doing lately.
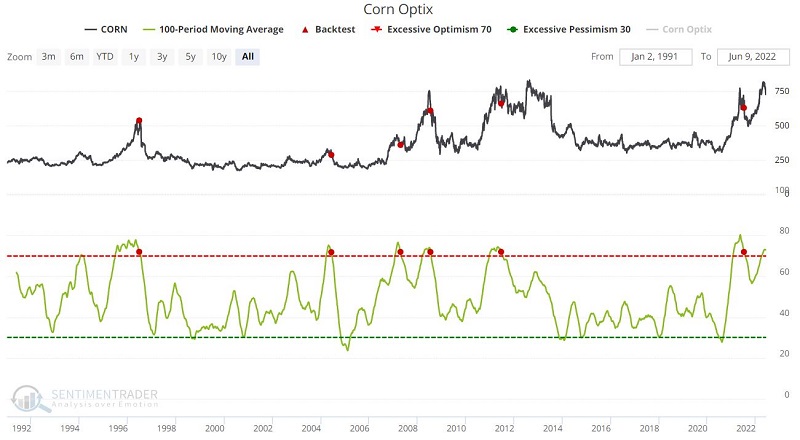
There is no reason that this year may be an exception to the rule for corn. But the real question is, "Is a long position in corn the best way to allocate my capital?"
Natural Gas
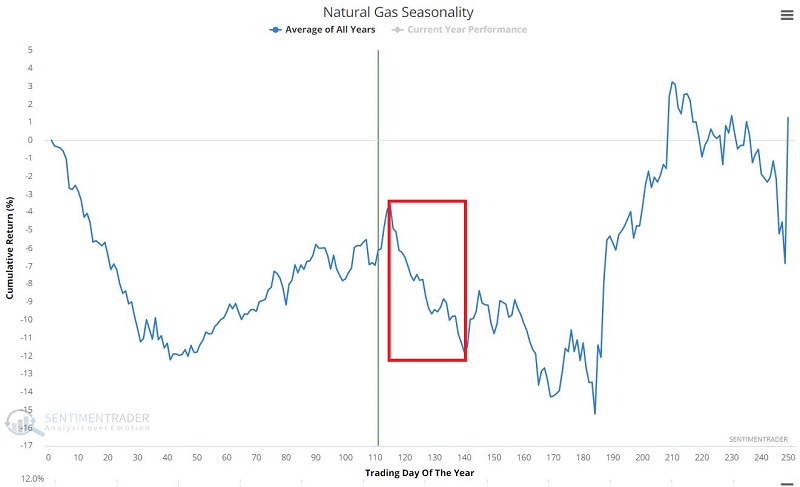
This is another market that has enjoyed a terrific run but which will soon face seasonal resistance. The chart below displays the annual seasonal trend for natural gas futures. The obvious thing to note is the period from TDY #115 through TDY #140. For 2022, this period extends from the close on 6/16 through 7/22.
The chart below displays the $ +(-) from holding a long position in natural gas futures from Trading Day of the Year #115 through TDY #140 since 1990.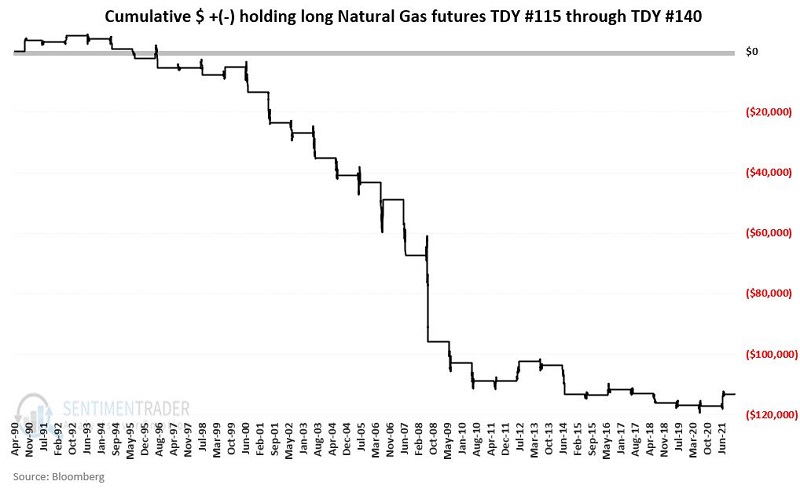
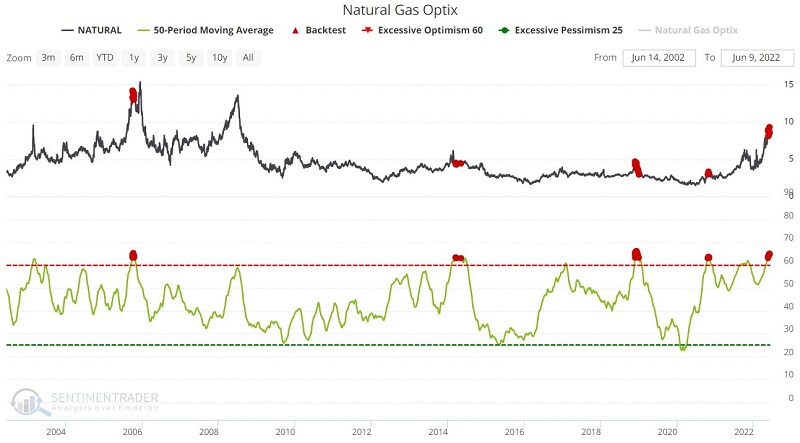
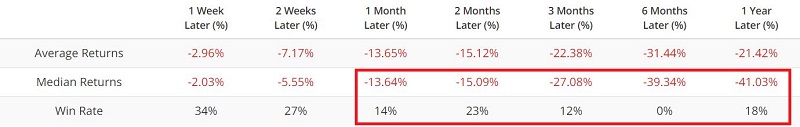
Sentiment is another potential stumbling block for natural gas. The chart and table below highlight those times when the 50-day average of natural gas Optix was above 63. Forward results have tended to be extremely weak.
What the research tells us…
Seasonality is rarely something that should be relied on as a standalone indicator. However, the more persistent a seasonal trend has been over time, the more valuable it can be in pointing traders towards meaningful opportunities - particularly when combined with other confirming indicators.