
Seasonal setups to be aware of

Key points
- Seasonality is "climate, not weather," so it should rarely be relied upon on a standalone basis
- A wide array of indexes and sectors are entering a highly favorable seasonal period
- This does not guarantee an impending market rally, but when combined with favorable price action, that is generally the way to play until the market tells us otherwise
A plethora of seasonal opportunities
Let's examine a variety of index and sector ETFs that have shown a strong historical propensity to rally during the fourth quarter of the year.
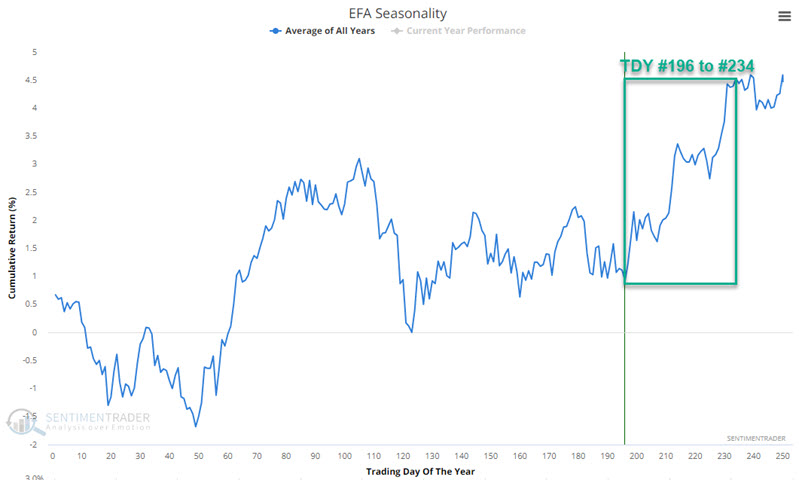
The iShares MSCI EAFE ETF (EFA) tracks the MSCI EAFE Index. The chart below displays the annual seasonal trend for EFA and highlights the TDY #196 through #234 period. For 2024, this period extends from the close of 2024-10-10 through 2024-12-04.
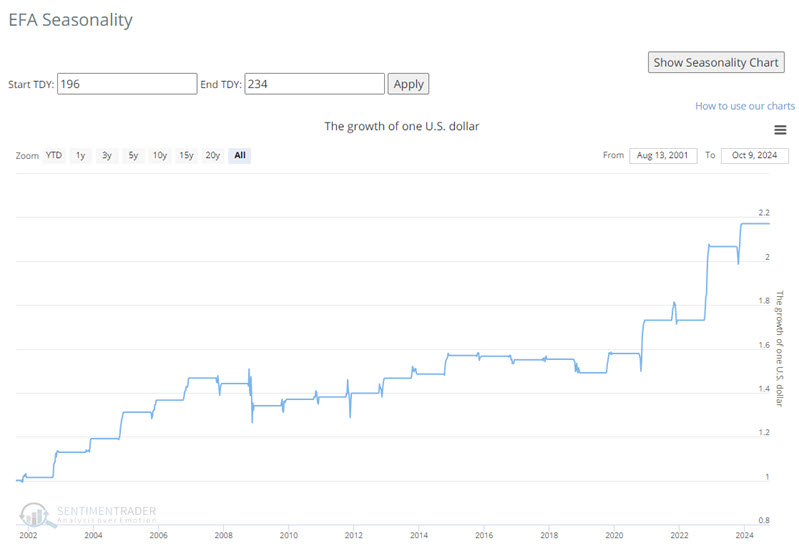
The chart below displays the hypothetical growth of $1 invested in EFA only during this period since 2001. That hypothetical $1 has grown to $2.17.
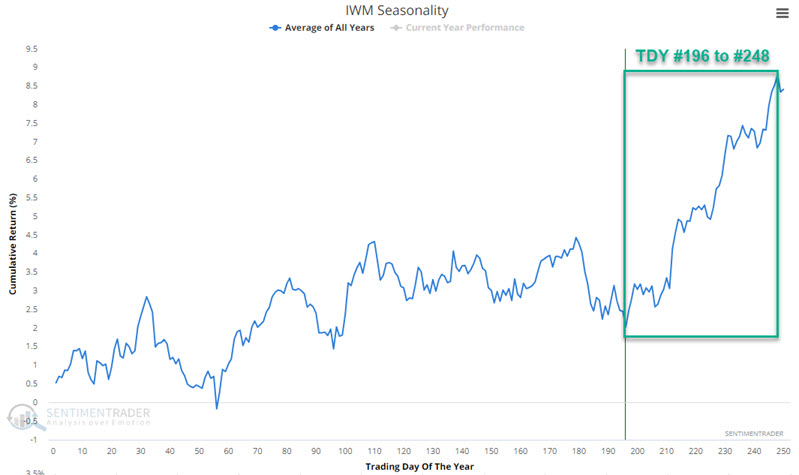
The iShares Russell 2000 ETF (IWM) tracks the Russell 2000 (small cap) Index. The chart below displays the annual seasonal trend for EFA and highlights the TDY #196 through #248 period. For 2024, this period extends from the close of 2024-10-10 through 2024-12-24.
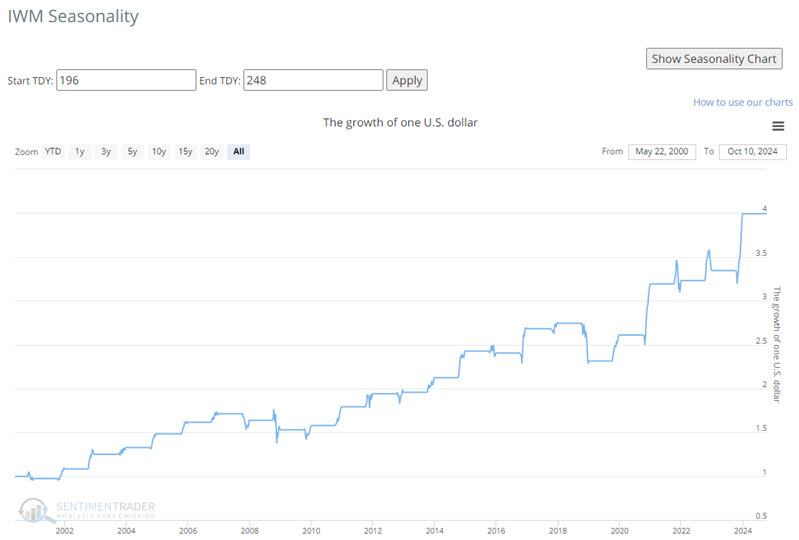
The chart below displays the hypothetical growth of $1 invested in IWM only during this period since 2000. That hypothetical $1 has grown to $3.99.
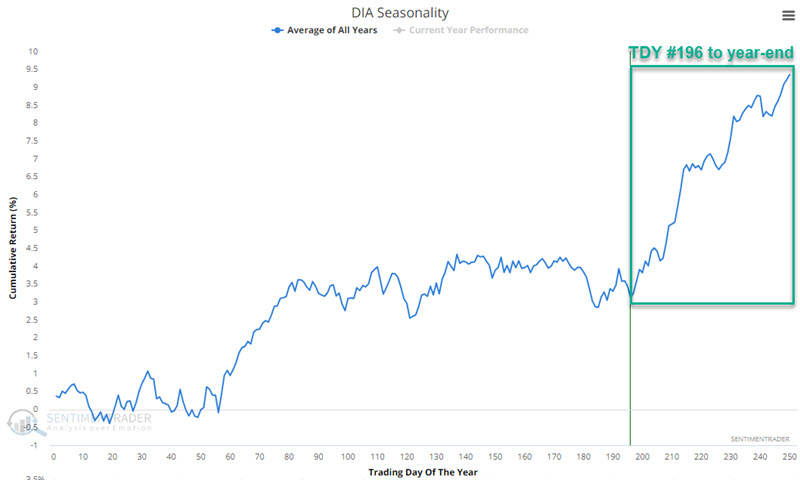
The SPDR Dow Jones Industrial Average ETF Trust (DIA) tracks the Dow Jones Industrial Average. The chart below displays the annual seasonal trend for DIA and highlights the TDY #196 through #255 period. For 2024, this period extends from the close of 2024-10-10 through 2024-12-31.
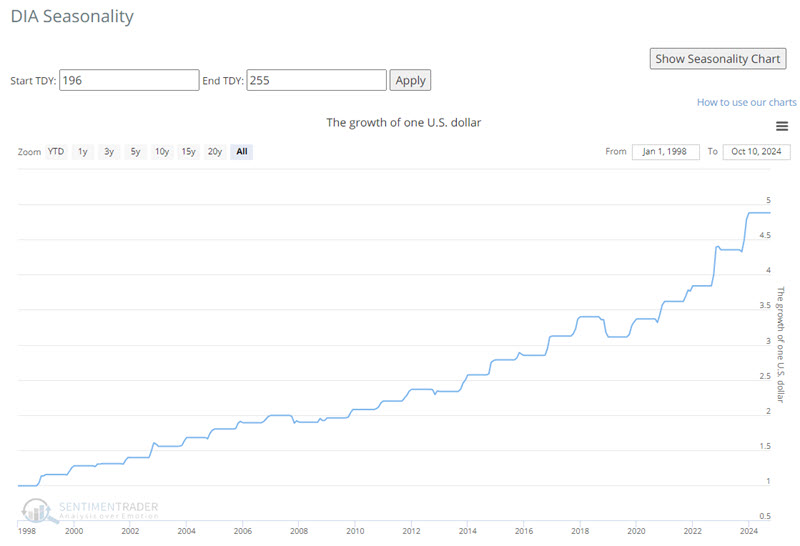
The chart below displays the hypothetical growth of $1 invested in DIA only during this period since 1998. That hypothetical $1 has grown to $4.88.
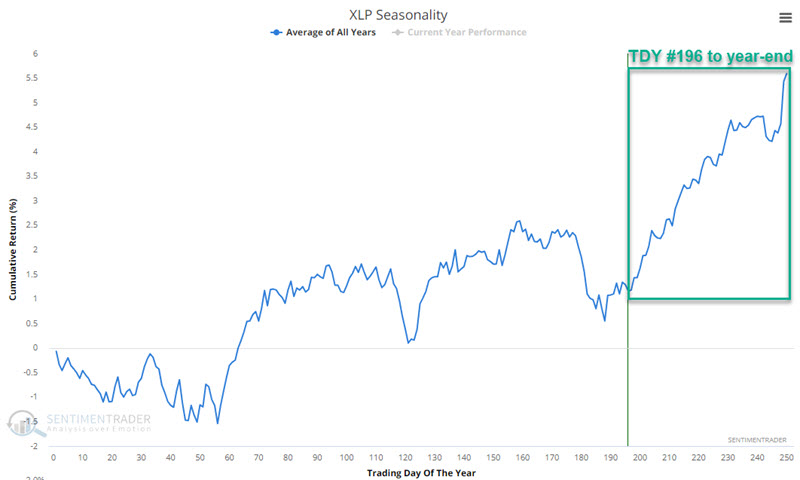
The Consumer Staples Select Sector SPDR Fund (XLP) tracks the S&P 500 Consumer Staples index. The chart below displays the annual seasonal trend for XLP and highlights the TDY #196 through #255 period. For 2024, this period extends from the close of 2024-10-10 through 2024-12-31.
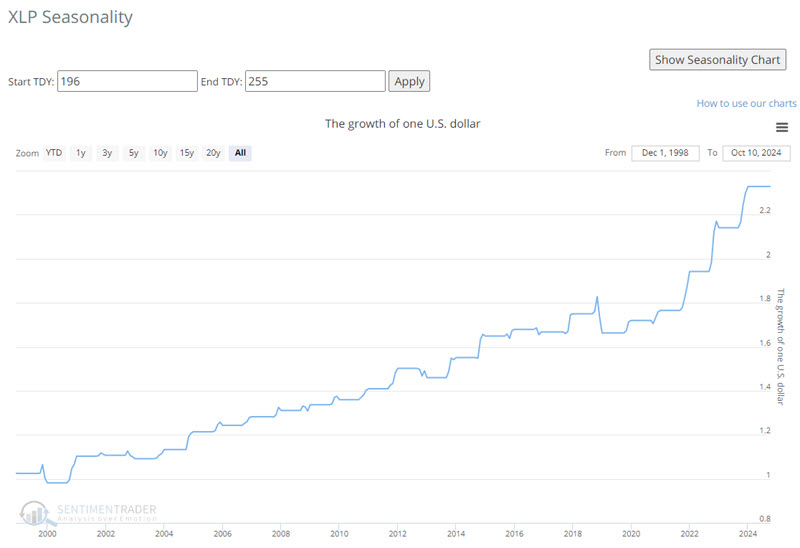
The chart below displays the hypothetical growth of $1 invested in XLP only during this period since 1999. That hypothetical $1 has grown to $2.25.
The Materials Select Sector SPDR Fund (XLB) tracks the S&P 500 Materials index. The chart below displays the annual seasonal trend for XLB and highlights the TDY #196 through #255 period. For 2024, this period extends from the close of 2024-10-10 through 2024-12-31.
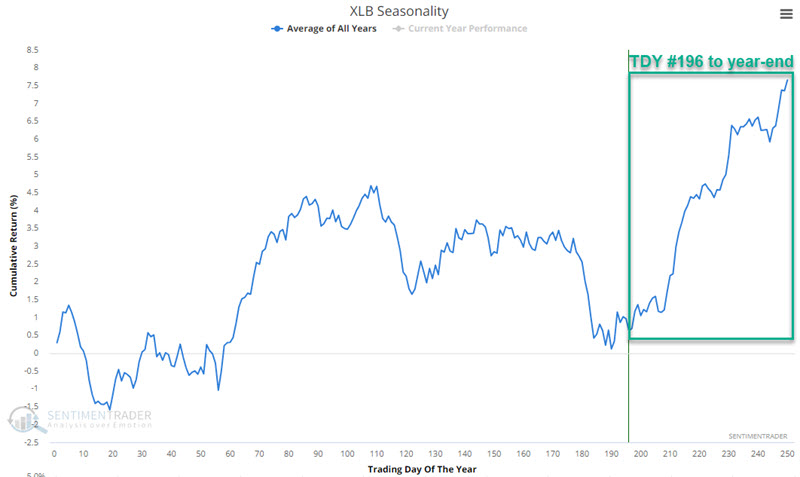
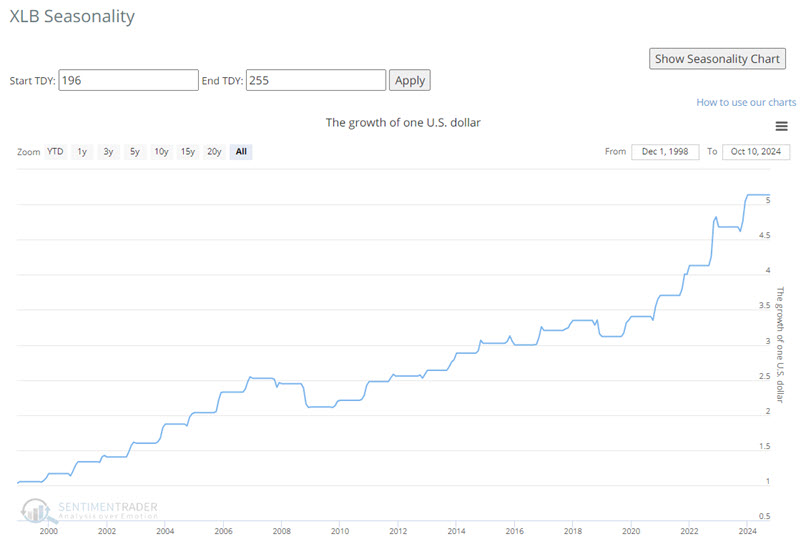
The chart below displays the hypothetical growth of $1 invested in XLB only during this period since 1999. That hypothetical $1 has grown to $5.14.
The Technology Select Sector SPDR Fund (XLK) tracks the S&P 500 Technology index. The chart below displays the annual seasonal trend for XLK and highlights the TDY #196 through #255 period. For 2024, this period extends from the close of 2024-10-10 through 2024-12-31.
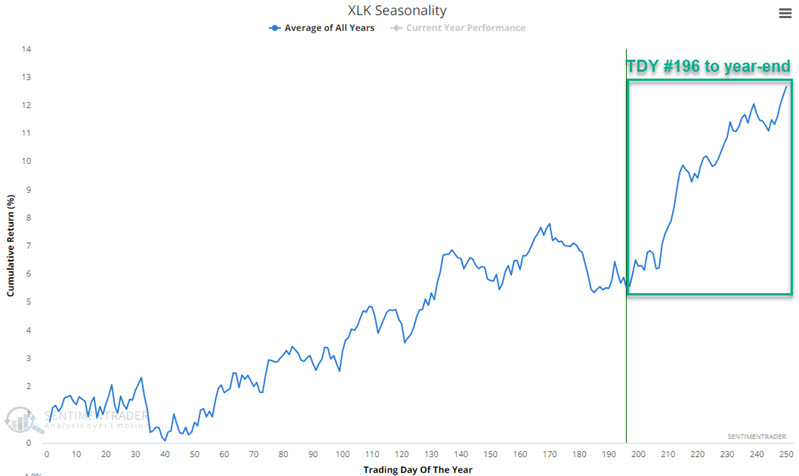
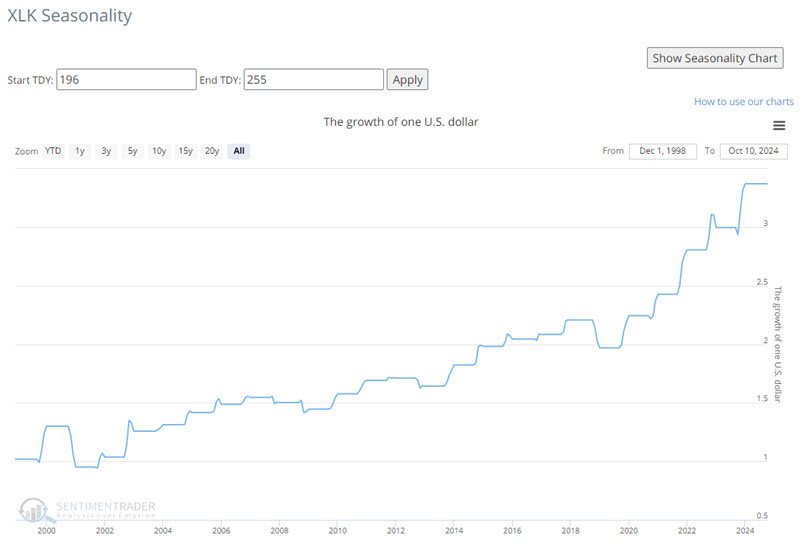
The chart below displays the hypothetical growth of $1 invested in XLK only during this period since 1999. That hypothetical $1 has grown to $3.37
What the research tells us…
It is rarely a good idea to rely solely on seasonality as the basis for entering a trade. That said, combining seasonality with price action can be a surprisingly potent combination. Suppose seasonality says that something "should" be going up, AND that particular index, sector, or commodity IS going up. That can be an exceptionally good time to climb on board and ride the trend. The caveat is that there are no guarantees. Expected seasonal movements can fail to materialize, and even the most persistent price trends can turn on a dime. Let's add the adage that "trees don't grow to the sky" and that, yes, it has been awfully easy to make money in the stock market in 2024. So, risk control remains the responsibility of each individual investor.
Considering those caveats, investors and traders may find opportunities among the ETFs highlighted above for now.