
Seasonal sectors to consider - and others to avoid

Key points
- Seasonality can be especially helpful in deciding when and where to allocate capital
- The health care sector and natural gas are entering favorable seasonal periods
- Meanwhile, copper miners, homebuilders, Japanese stocks, and the transportation sector are entering unfavorable seasonal periods
Two favorable areas to focus on
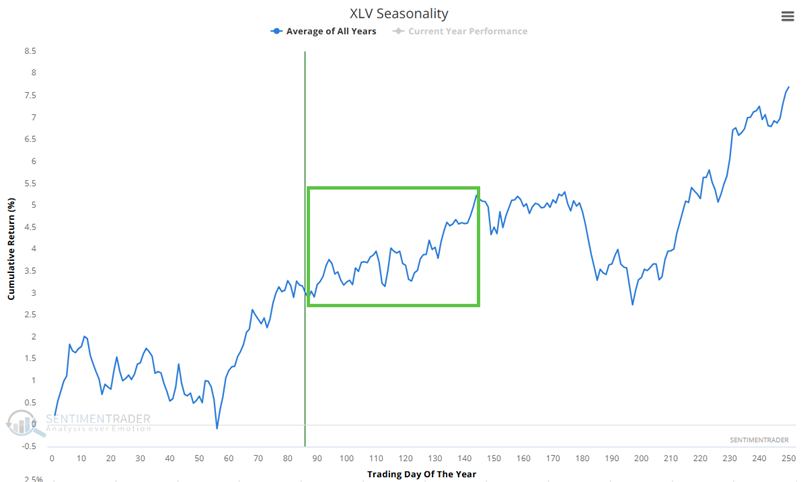
The Annual Seasonal Trend chart below for The Health Care Select Sector SPDR Fund (XLV) shows a favorable period that extends from the close of Trading Day of the Year (TDY) #87 through TDY #144. For 2025, this period extends from the close on 2025-05-08 through 2025-07-31.
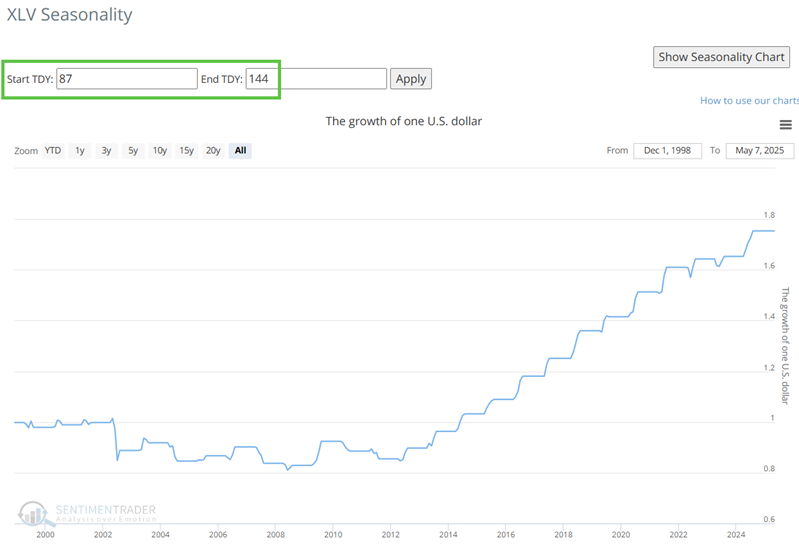
The chart below displays the hypothetical growth of $1 invested in XLV only during this period, every year since 1999.
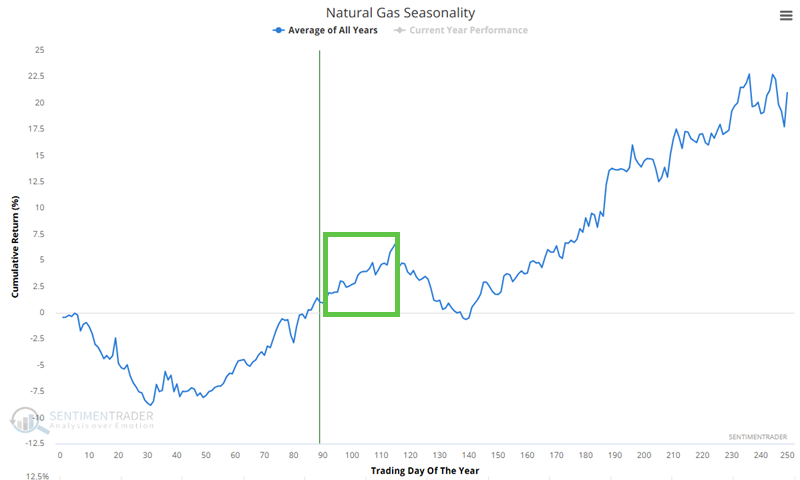
The Annual Seasonal Trend chart below for Natural Gas shows a favorable period that extends from the close of Trading Day of the Year (TDY) #90 through TDY #115. This can be traded via an ETF - the United States Natural Gas Fund, LP (UNG). For 2025, this period extends from the close on 2025-05-13 through 2025-06-18.
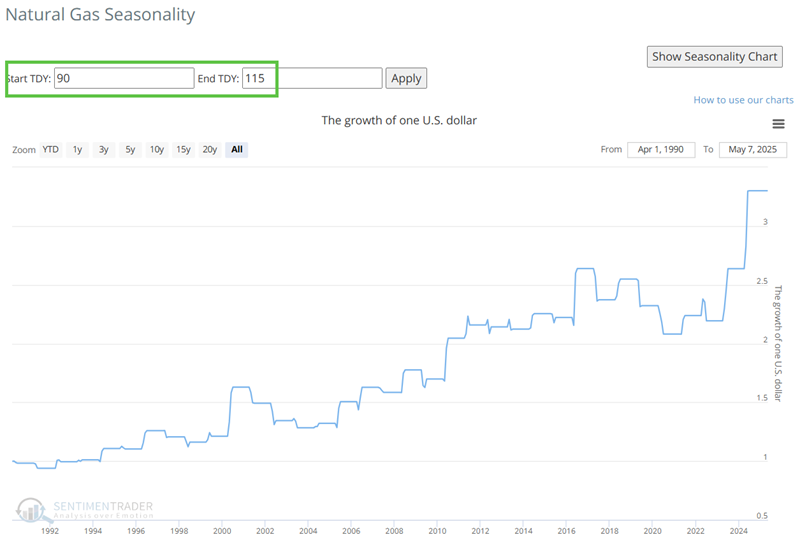
The chart below displays the hypothetical growth of $1 invested in natural gas only during this period, every year since 1991.
And several unfavorable areas
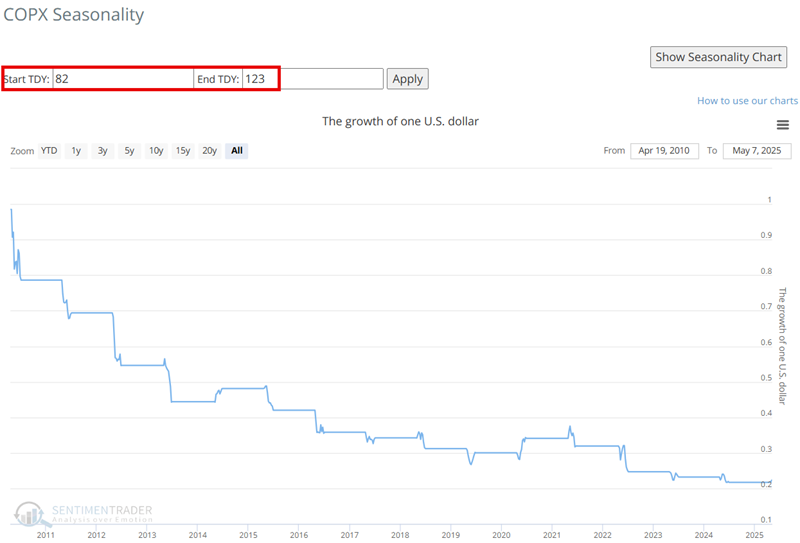
The Annual Seasonal Trend chart below for the Global X Copper Miners ETF (COPX) shows an unfavorable period that extends from the close of Trading Day of the Year (TDY) #82 through TDY #123. For 2025, this period began at the close on 2025-05-01 and extends through 2025-07-01.
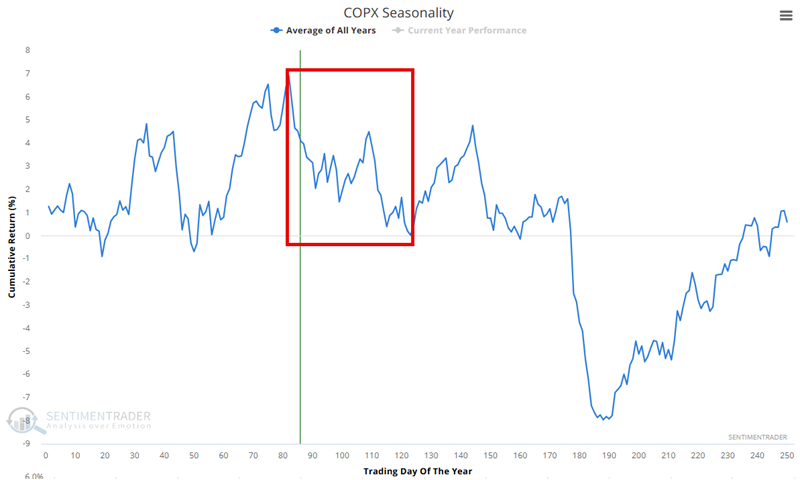
The chart below displays the hypothetical growth of $1 invested in COPX only during this period, every year since 2010.
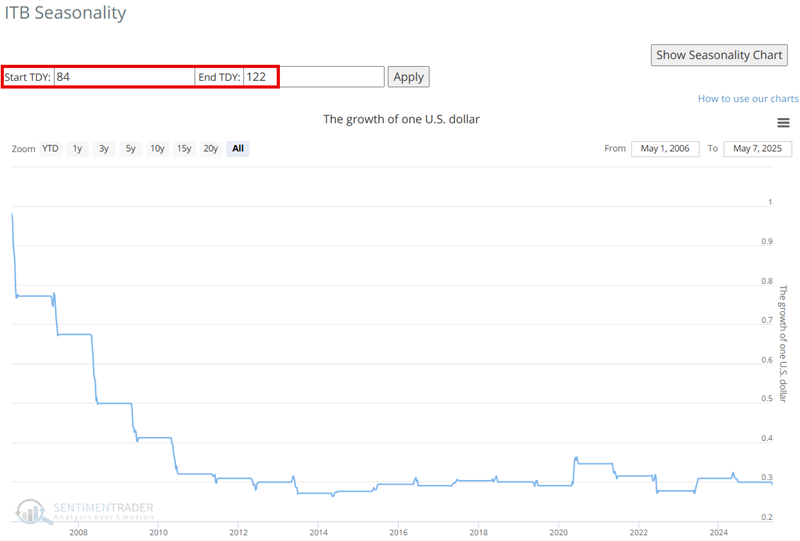
Homebuilders have been weak, but seasonality suggests that now is not the time to try to pick a bottom. The Annual Seasonal Trend chart below for the iShares U.S. Home Construction ETF (ITB) shows an unfavorable period that extends from the close of Trading Day of the Year (TDY) #82 through TDY #123. For 2025, this period began at the close on 2025-05-05 and extends through 2025-06-30.
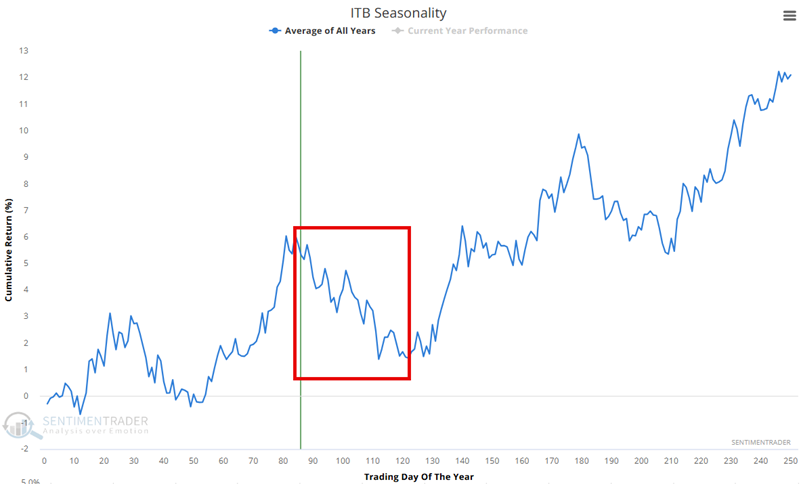
The chart below displays the hypothetical growth of $1 invested in ITB only during this period every year since 2006.
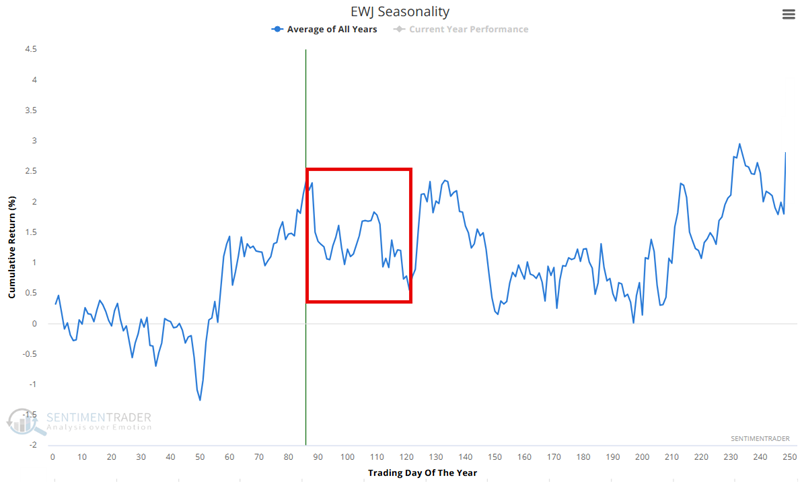
On the other hand, Japanese stocks have rallied sharply since bottoming in early April. The iShares MSCI Japan ETF (EWJ) recently touched a new all-time high. Seasonality, however, suggests that now may not be the time to chase this market.
The Annual Seasonal Trend chart below for EWJ shows an unfavorable period that extends from the close of Trading Day of the Year (TDY) #86 through TDY #121. For 2025, this period began at the close on 2025-05-07 and extends through 2025-06-27.
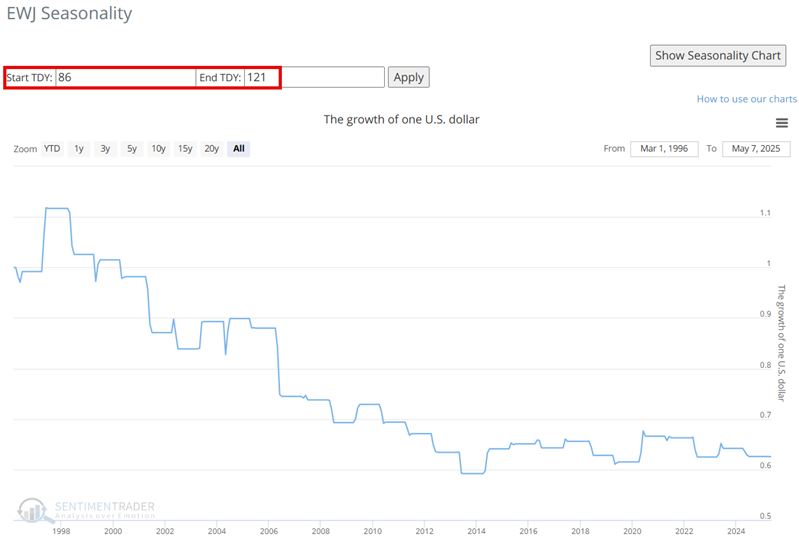
The chart below displays the hypothetical growth of $1 invested in EWJ only during this period every year since 1996.
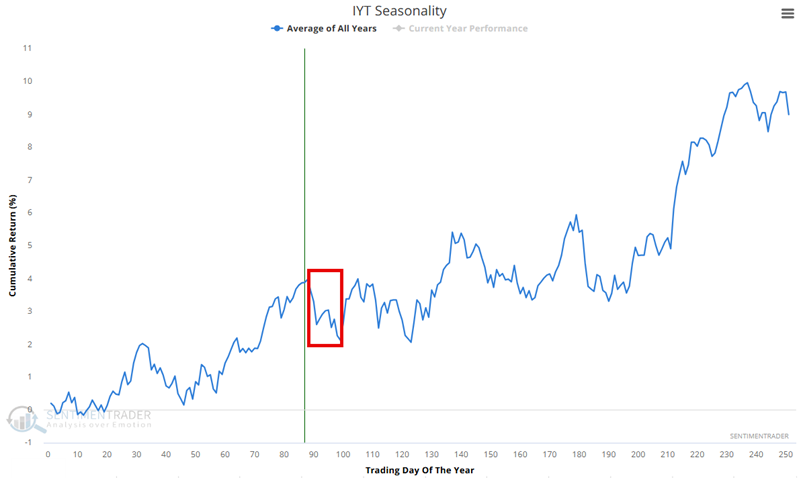
One sector that is a good candidate for investors to avoid in the near term is transportation. The Annual Seasonal Trend chart below for the iShares US Transportation ETF (IYT) shows an unfavorable period that extends from the close of Trading Day of the Year (TDY) #88 through TDY #99. For 2025, this period begins at the close on 2025-05-09 and extends through 2025-05-27.
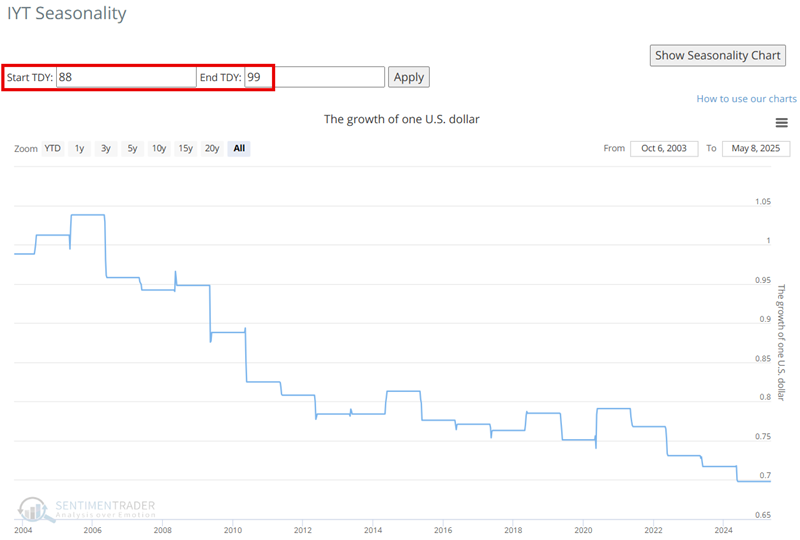
The chart below displays the hypothetical growth of $1 invested in IYT only during this period, every year since 2004.
What the research tells us…
Seasonality is merely a summation of the past, NOT a roadmap to the future. Per Michael Santoli's famous quote, "Seasonality is climate, not weather." For my purposes, I use seasonality to tell me "when to look where." At the moment, and in the weeks ahead, I will look for opportunities to play the long side of the healthcare sector and natural gas. Meanwhile, it might make sense to avoid the abovementioned sectors that are entering unfavorable seasonal periods and allocate elsewhere.