
Seasonal opportunities for traders to be aware of

Key Points
- Many commodities have strong seasonal tendencies and can be traded via ETFs
- Markets of interest now or very shortly include Unleaded Gas, the Euro, the British Pound, Soybeans, Copper, and Palladium
- Seasonal tendencies tend to be most useful when seasonality and price trends agree
Unleaded Gas, Soybeans, Copper, and Palladium near favorable periods
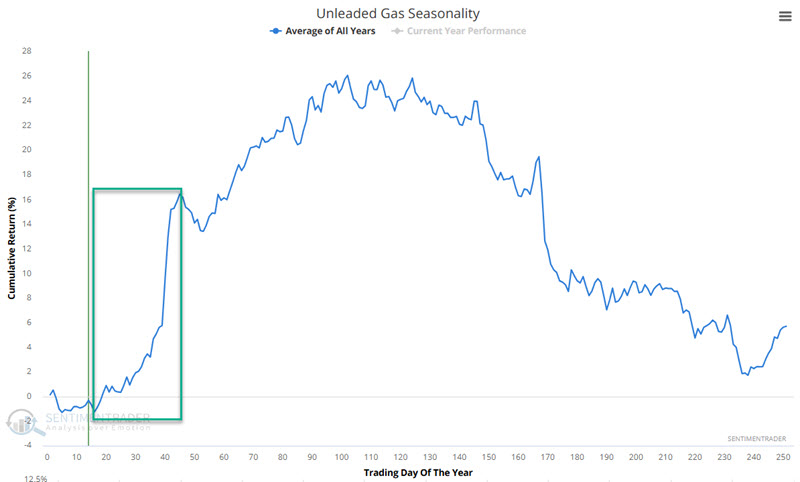
Unleaded Gas
The chart below displays the annual seasonal trend for unleaded gas futures. A favorable period runs from Trading Day of Year (TDY) #16 through #45. For 2025, that period extends from the close on 2025-01-23 Through 2025-03-05.
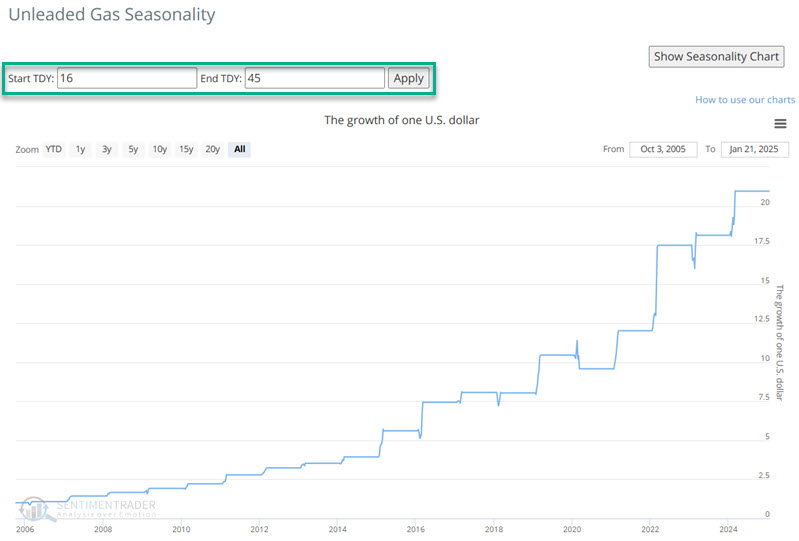
The chart below displays the hypothetical growth of $1 based on percentage price movements for unleaded gas futures during the TDY #16 through TDY #45 period every year starting in 2006.
The chart below shows price action for unleaded gas futures. Note that the price is presently above the 70-day exponential moving average. As long as the price holds above that average, seasonality and price action will agree.
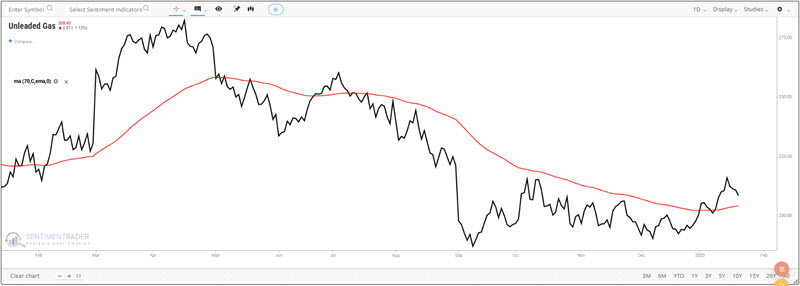
Note that non-futures traders can gain exposure to the unleaded gas market in a stock account by buying shares of The United States Gasoline Fund (ticker UGA).
Soybeans
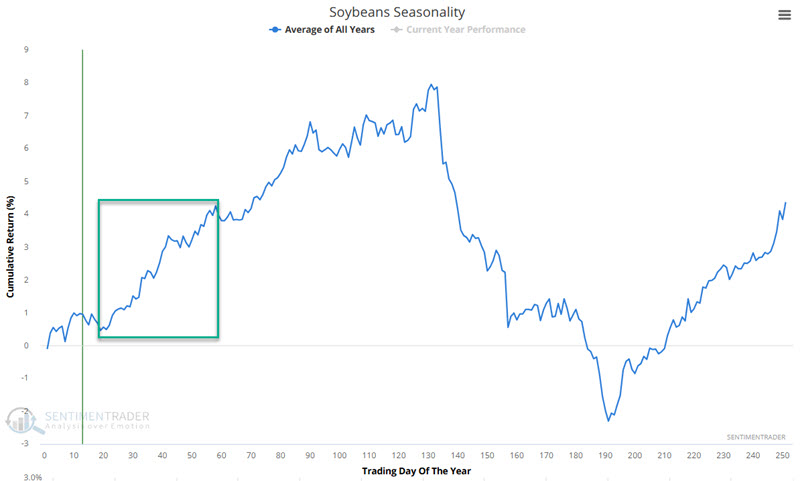
Soybeans have a history of being one of the most reliable seasonal markets (primarily due to the planting cycle in the U.S.). Before and through planting season in early Spring is when doubt surrounding the current year's crop is most in doubt. This typically leads to higher prices - although 2024 was a notable exception, and nothing is guaranteed for 2025.
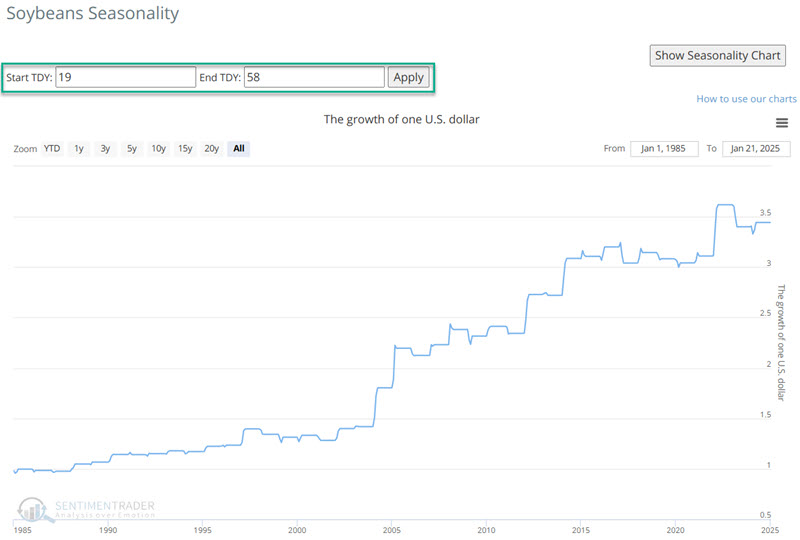
The chart below displays the annual seasonal trend for soybean futures. A favorable period runs from Trading Day of Year (TDY) #19 through #58. For 2025, that period extends from the close on 2025-01-30 Through 2025-03-27.
The chart below displays the hypothetical growth of $1 based on percentage price movements for soybean futures during the TDY #19 through TDY #58 period every year starting in 1985.
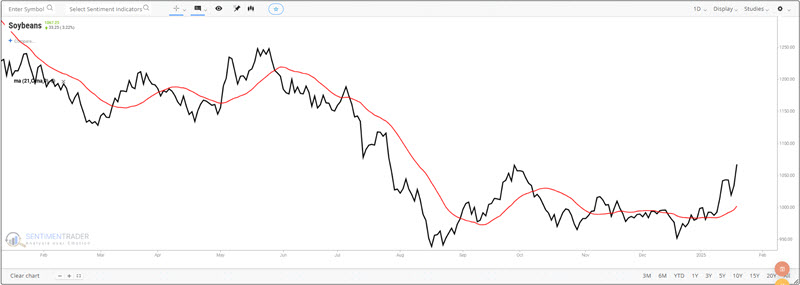
The chart below shows price action for soybean futures. Note that the price is presently above the 70-day exponential moving average. As long as the price holds above that average, seasonality and price action will agree.
Note that non-futures traders can gain exposure to the soybean market in a stock account by buying shares of the Teucrium Soybean fund ETF (ticker SOYB).
Copper
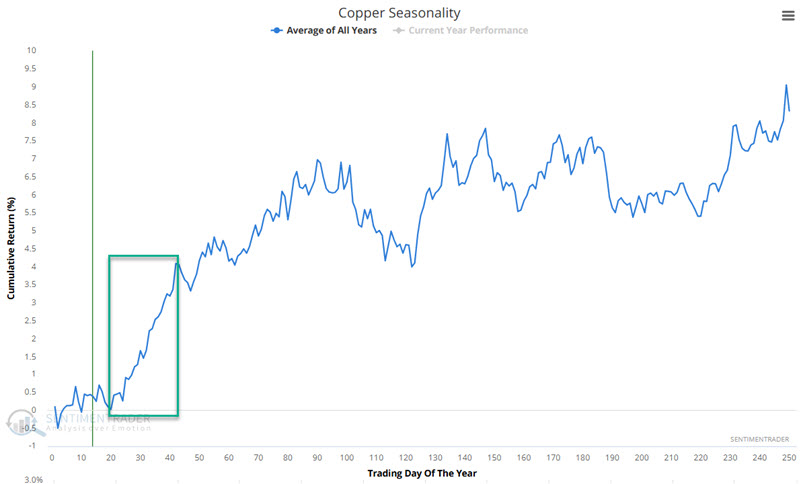
The chart below displays the annual seasonal trend for copper futures. A favorable period runs from Trading Day of Year (TDY) #20 through #42. For 2025, that period extends from the close on 2025-01-29 Through 2025-02-28.
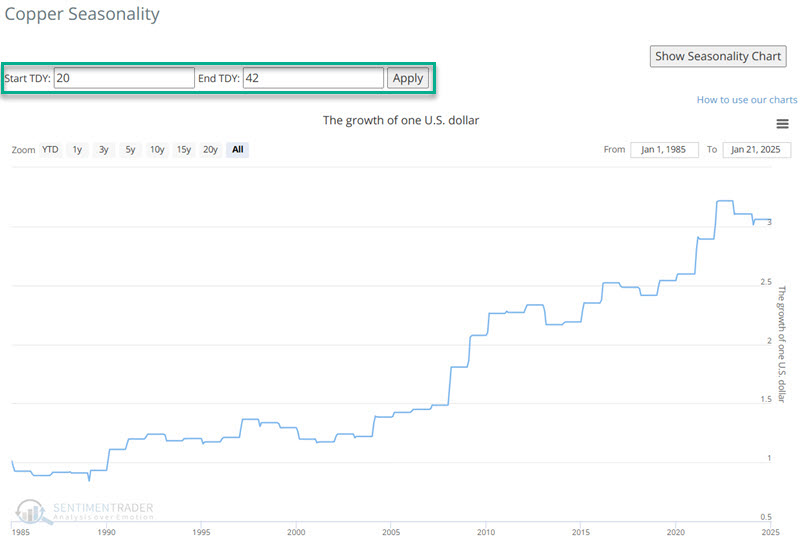
The chart below displays the hypothetical growth of $1 based on percentage price movements for copper futures during the TDY #20 through TDY #42 period every year starting in 1985.
The chart below shows price action for copper futures. Note that the price is presently above the 70-day exponential moving average. As long as the price holds above that average, seasonality and price action will agree.
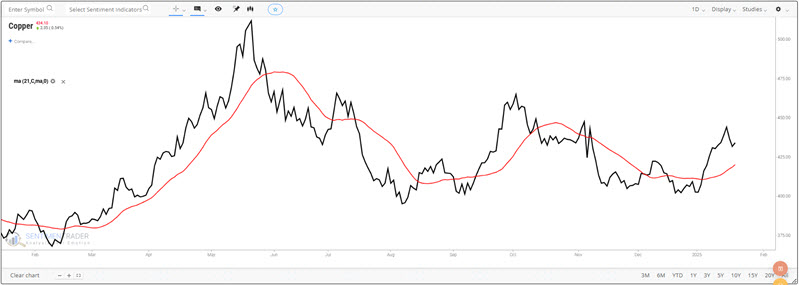
Note that non-futures traders can gain exposure to the copper market in a stock account by buying the United States Copper Index Fund (ticker CPER) shares.
Palladium
The chart below displays the annual seasonal trend for palladium futures. A favorable period runs from Trading Day of Year (TDY) #21 through #47. For 2025, that period extends from the close on 2025-01-30 Through 2025-03-07.
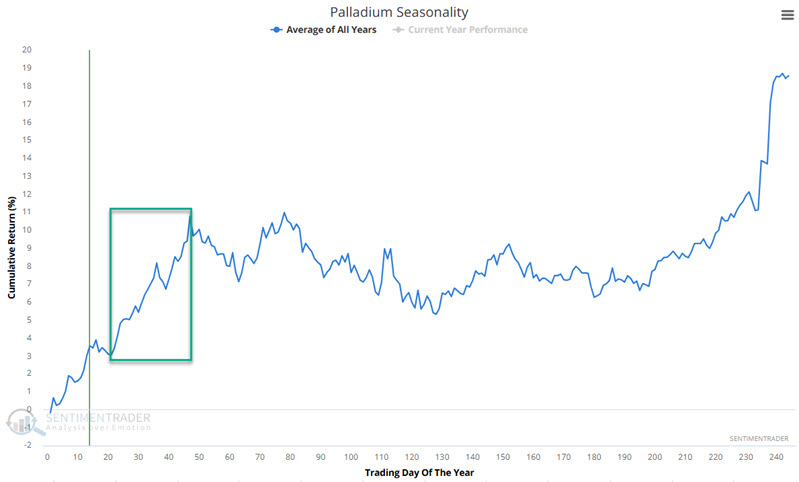
The chart below displays the hypothetical growth of $1 based on percentage price movements for palladium futures during the TDY #21 through TDY #47 period every year starting in 1993.

The chart below shows price action for palladium futures. Note that the price is presently above the 70-day exponential moving average. As long as the price holds above that average, seasonality and price action will agree.
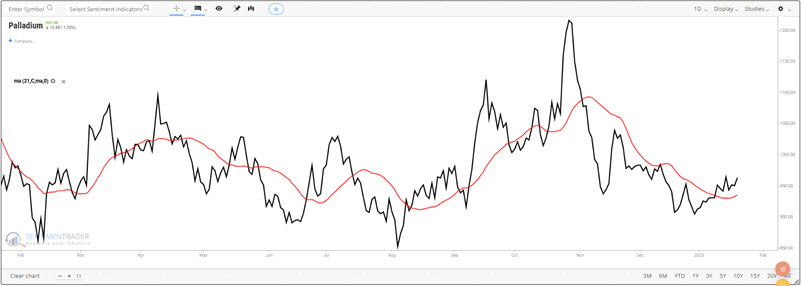
Note that non-futures traders can gain exposure to the palladium market in a stock account by buying shares of the adrdn Physical Palladium Shares (ticker PALL).
Currencies tend to experience early-year weakness
Euro
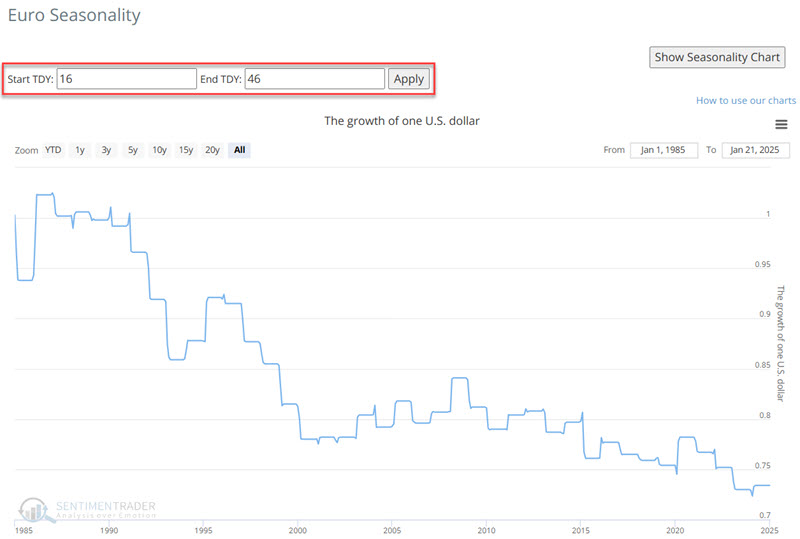
The chart below displays the annual seasonal trend for euro futures. An unfavorable period runs from Trading Day of Year (TDY) #16 through #46. For 2025, that period extends from the close on 2025-01-23 Through 2025-03-06.
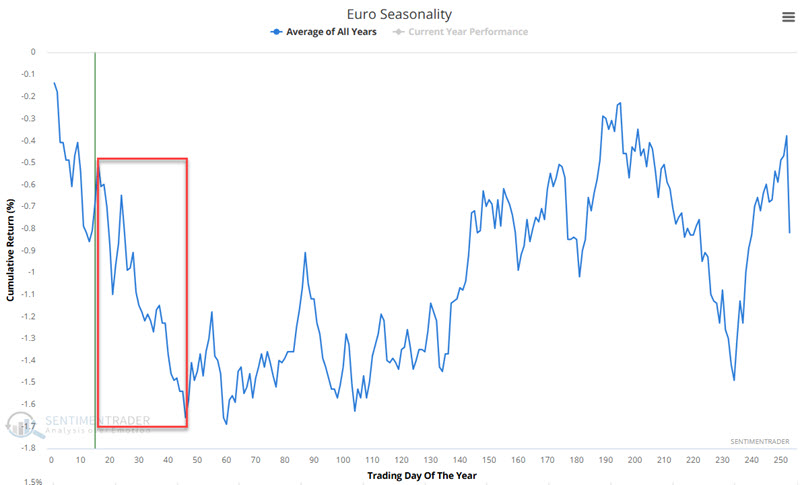
The chart below displays the hypothetical growth of $1 based on percentage price movements for euro futures during the TDY #16 through TDY #46 period every year starting in 1985.
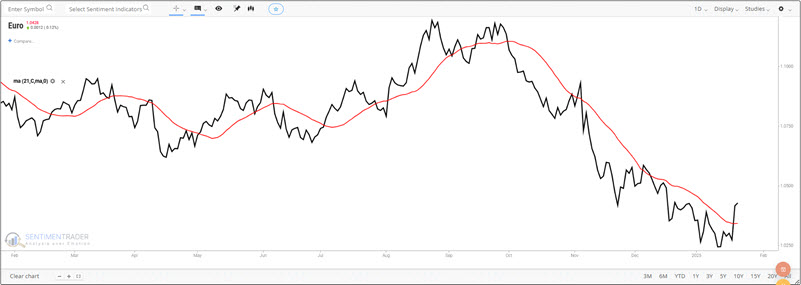
The chart below shows price action for euro futures. Note that the price is presently above the 70-day exponential moving average. Ideally, an aggressive trader would press their bet on the short side if and when euro futures fall back into a downtrend within the seasonal window above.
Note that non-futures traders can gain bearish exposure to the euro market in a stock account by selling short shares of Invesco CurrencyShares Trust (ticker FXE) or by buying shares of the ProShares UltraShort Euro ETF (ticker EUO). It is critical to note the elevated risk associated with either approach. Shorting shares of FXE technically entails unlimited risk, and buying shares of EUO involves a fund that attempts to track the daily percentage change for euro futures times two.
British Pound
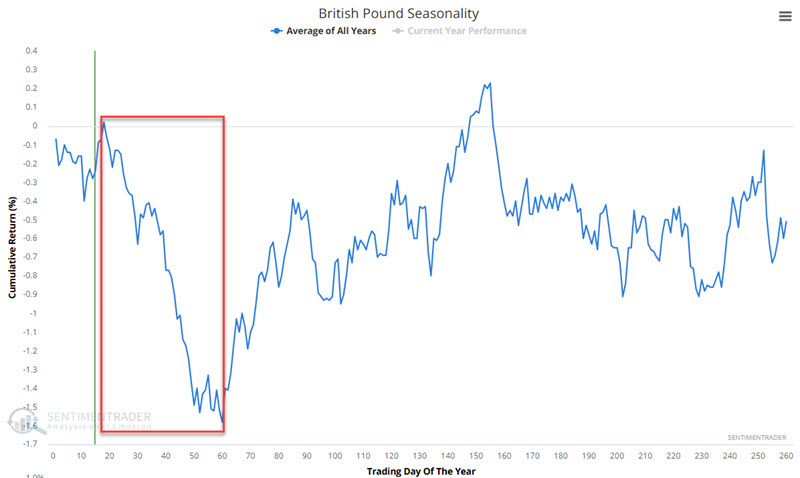
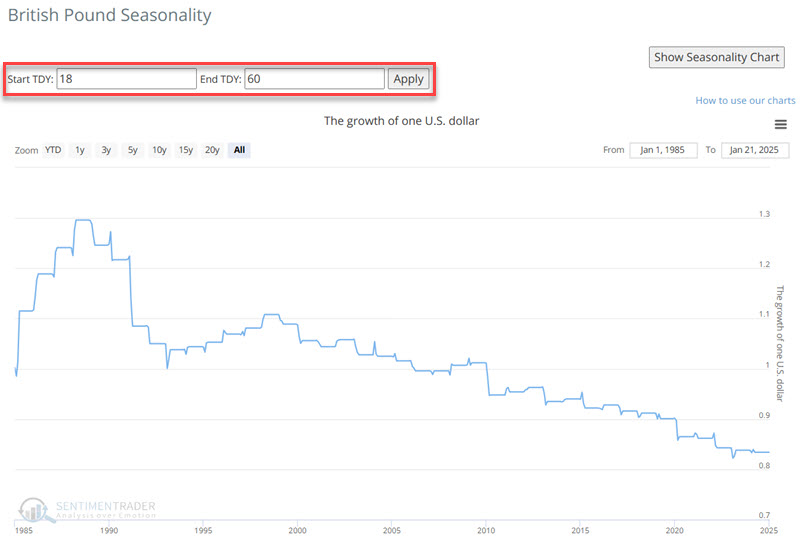
The chart below displays the annual seasonal trend for British pound futures. An unfavorable period runs from Trading Day of Year (TDY) #18 through #60. For 2025, that period extends from the close on 2025-01-27 Through 2025-03-26.
The chart below displays the hypothetical growth of $1 based on percentage price movements for British pound futures during the TDY #16 through TDY #46 period every year starting in 1985.
The chart below shows price action for British pound futures. Note that the price is presently above the 70-day exponential moving average. Ideally, an aggressive trader would press their bet on the short side if and when euro futures fall back into a downtrend within the seasonal window above.
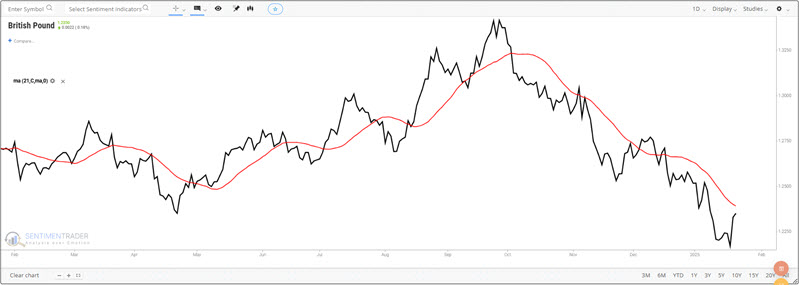
Note that non-futures traders can gain bearish exposure to the euro market in a stock account by selling short shares of Invesco CurrencyShares British Pound Sterling Trust (ticker FXB). It is critical to note the elevated risk associated with this approach, which technically entails unlimited risk.
What the research tells us...
As always, seasonality is "climate, not weather," and any historical seasonal trend - no matter how reliable in the past - can fail "this time." One of the best uses of seasonality is as a filter to guide us regarding "when to look where." A favorable seasonal trend tells us to look for a bullish opportunity, and an unfavorable one tells us to look for a bearish opportunity. With the above caveat, remember that the odds of success improve if seasonality (expected price action) and trend (actual price action) agree. On this basis, the markets highlighted above may offer good opportunities in the weeks and months ahead.