
Safe havens may prove elusive

Key points
- When the stock market declines - especially when it does so in a violent manner - many investors look for safe havens elsewhere
- Some evidence suggests that the US Dollar, gold stocks, and treasury bonds may not offer much in the way of returns as 2025 unfolds
- Below we highlight several sentiment and breadth indicators that question the amount of upside available in these markets
Not bullish on the buck
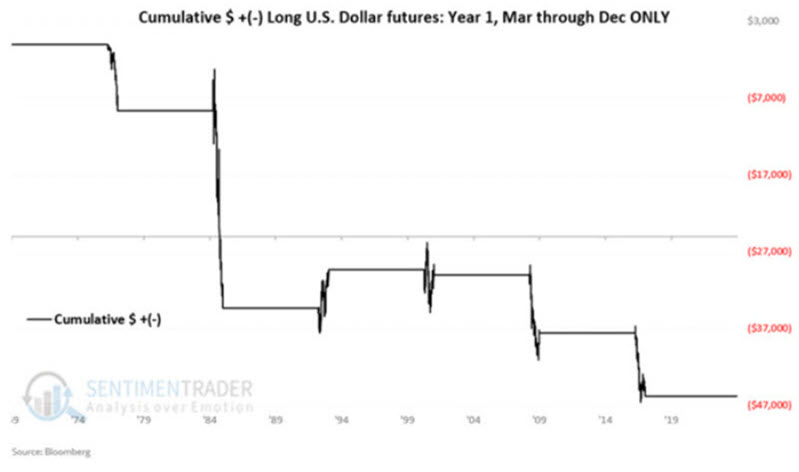
In these articles (here and here), I highlighted that 2025 is Year 1 of a new eight-year cycle for the US Dollar. I also highlighted that the last ten months (i.e., March through December) of Year 1 have had a history of significant weakness. The chart below displays the hypothetical growth of $1 invested in the US Dollar only during March through December of these years (1977, 1985, 1993, 2001, 2009, 2017).
Historically, gold and the US Dollar have traded inversely, with a correlation coefficient of -0.34. They are not "mirror images" regarding performance, but whatever affects one market tends to affect the other. For our test, we will utilize our Gold Optix indicator. The chart below highlights all days when:
The Gold Optix indicator was above 80, and;
The US Dollar was above its 100-day moving average
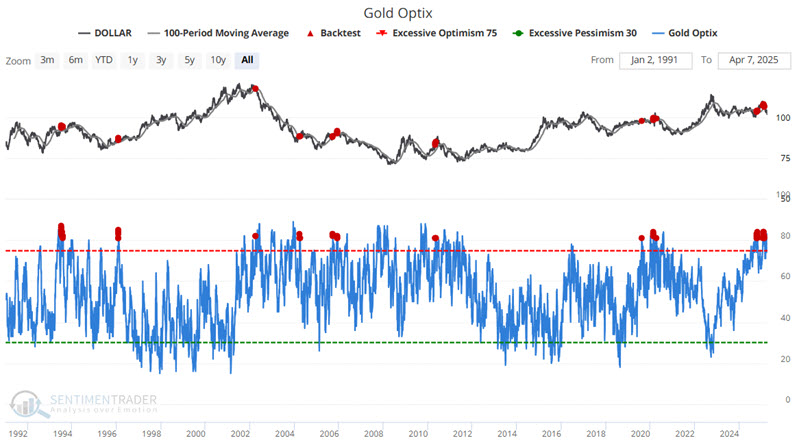
The table below summarizes subsequent US Dollar performance.
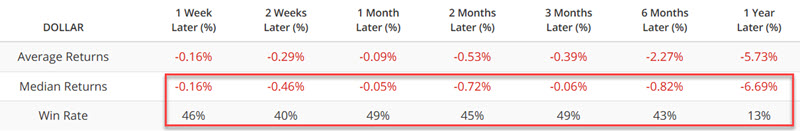
There are two key things to note. 1) Is the negative Average and Median returns and sub 50% Win rates across the board, and 2) the abysmal 13% Win Rate twelve months after a signal.
As always, past performance does not guarantee future results. That said, the combination of unfavorable seasonal (last ten months of Year 1) and sentiment (Gold Optix) factors strongly suggests that traders focus on the short side of the US Dollar.
One reason for caution in gold stocks
One of the trendiest prognostications before the Tariff tantrum was that gold stocks were destined to rally sharply following the metal's trend. Such a possibility can in no way be ruled out. However, recent sentiment readings cast a shadow over gold stock prospects in the year ahead.
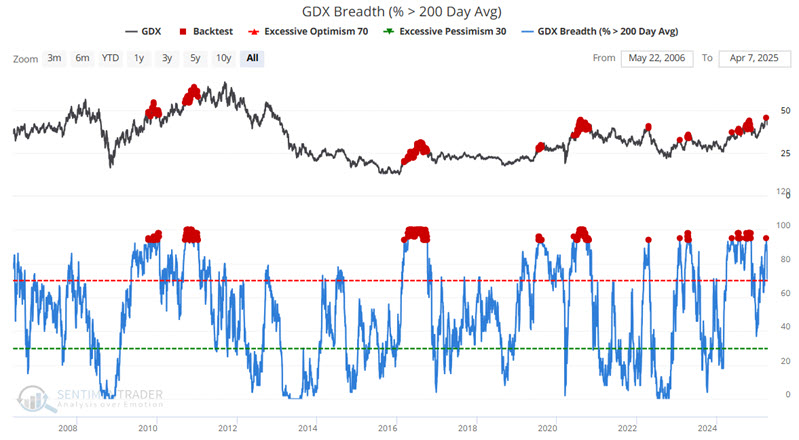
The table below summarizes GDX performance in the year after the signals shown in the chart above.
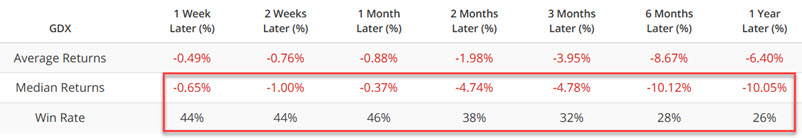
Like the US Dollar above, the results are negative (Median and Average return) with a below 50% Win Rate across the board and a particularly dismal -10.05% Median return and 26% Win Rate for 12 months. While this is only one indicator and does not guarantee negative results in the year ahead, it does suggest that traders see bullish price trend confirmation before taking a long position in gold stocks.
Still more headwinds for bonds
After a stunning multi-year decline, long-term treasury bonds bottomed out in October 2024 and have threatened to move higher meaningfully ever since. The current popular line of reasoning is that a trade war-related recession will force the Fed to cut interest rates, propelling a bull market in bonds. This is a possibility. However, most of the indicators and methods I follow for bonds are still unfavorable.
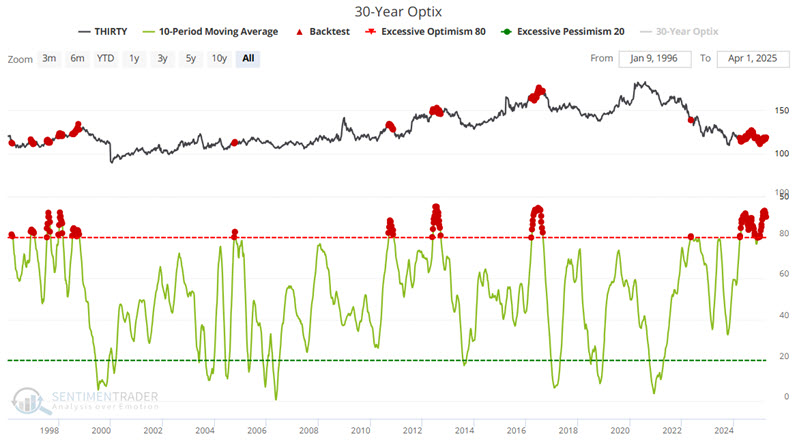
The chart below highlights all dates when the 10-day moving average of our Thirty Optix indicator was above 80.
The table below summarizes thirty-year treasury bond performance in the twelve months following the dates highlighted in the chart above.
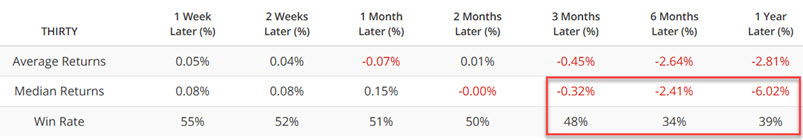
These results provide weight of the evidence suggesting that the long-awaited "bond bounce back" may not unfold as many hope.
What the research tells us…
It is essential to remember that the signals from the indicators for the markets highlighted above are weight of the evidence and not specific trading signals. That said, the real point is that the US Dollar, gold stocks, and long-term treasuries may prove disappointing for investors looking for a "safe haven" from a stock market selloff.