
Russell 2000 Has Stayed Above Its Average for 100 Days

Key Points:
- The Russell 2000 Index has closed above its 252-day moving average for 100 consecutive trading days.
- This marks the 28th time in the past 45 years that the index has remained above this average for such an extended period.
- The index is not easily profitable via trend-following strategies; following other momentum runs, returns have been volatile and win rates far from perfect.
A milestone achievement
At the end of June 2025, the small-cap Russell 2000 Index finally closed above its 252-day moving average. For many, this was the first genuine signal of a potential shift in the long-term trend, as buying assets below the 252-day moving average has long been considered taboo.
As long as investors can weather short-term volatility, they stand to profit in the end. Since breaking above the average, the index has not fallen back below it except for a minor pullback in between.
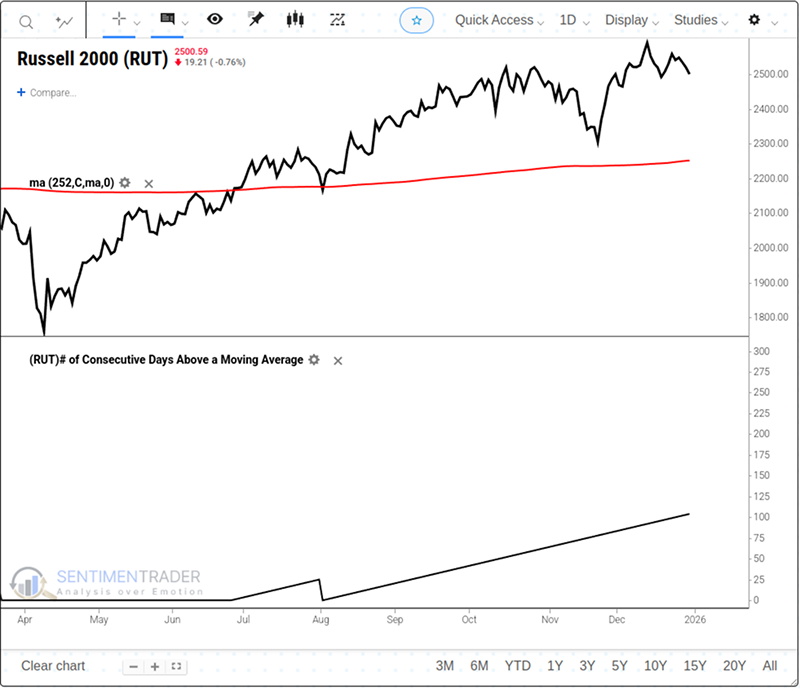
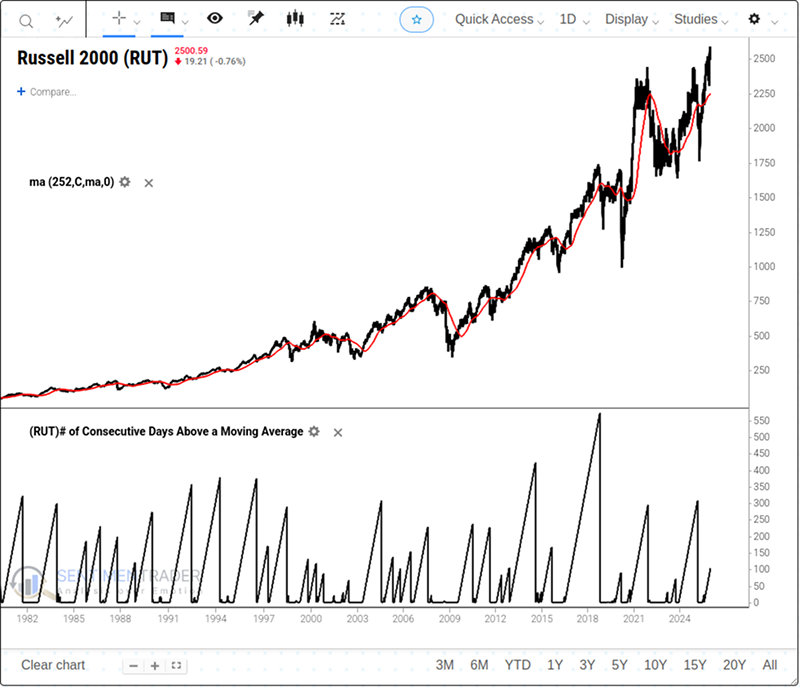
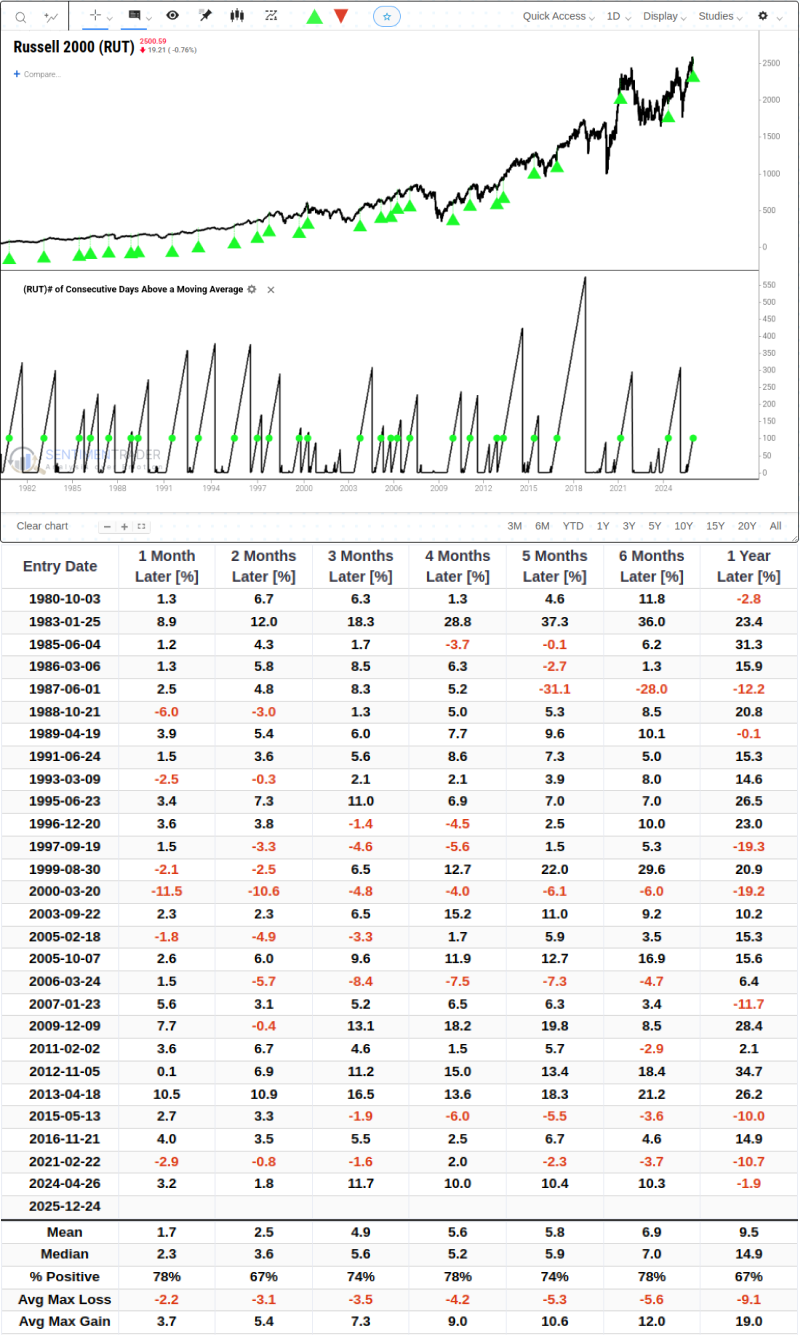
The Russell 2000 Index has just logged its 100th consecutive trading day above the 252-day moving average. This is a relatively rare feat for the index, as such a sustained run above the average has occurred only 28 times in the past 45 years.
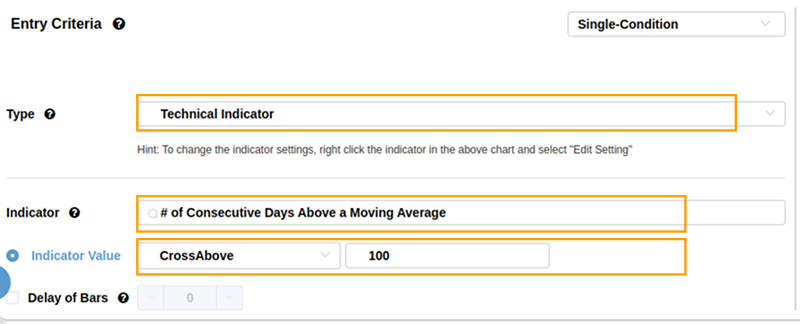
You can click on technical indicators in our BacktestEdge and search for "# of Consecutive Days Above a Moving Average" to view the number of days the price remained above its moving average.
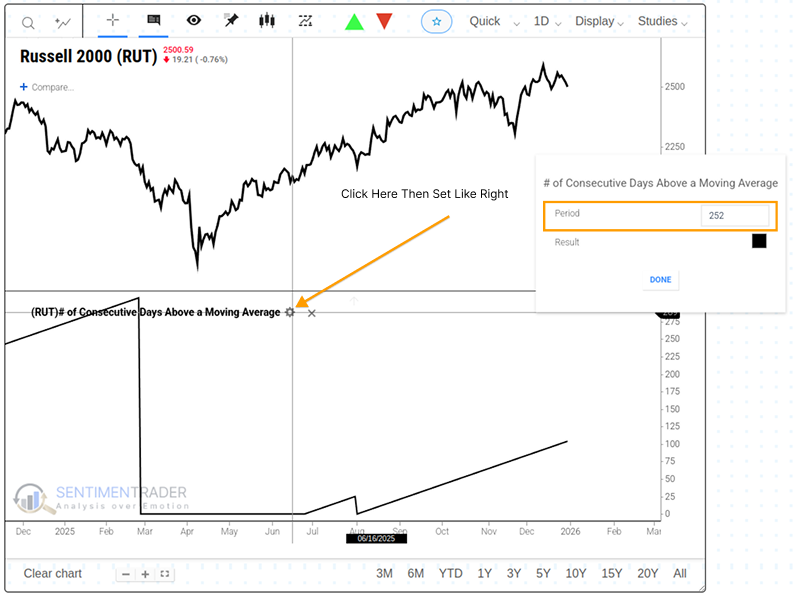
Similar to the tutorial mentioned in previous articles, you can still click the gear icon on the chart to set the moving average period and view the number of days the price exceeded different moving average periods.
Struggling to sustain momentum
Some stock indices are less responsive to trends than others, and the Russell Index is one of them.
The chart below shows the forward returns of the index after it has stayed above its 252-day average for 100 consecutive days. The win rate hovers around 75% for most timeframes, except for 67% at the two-month and one-year marks. Notably, following the signal on June 1, 1987, there was a loss of 31.1% over the subsequent five months, while after the signal on March 20, 2000, the index recorded a double-digit drawdown within one month, with all returns during this period in negative territory.Related Backtest Click Here.
Part of the problem with certain prolonged losses is that the Russell 2000 Index has remained above both its 252-day moving average and 50-day moving average for an extended period. This divides the signal into short-term and long-term performance. Based on these signals, the win rate remains consistently high nearly three months later.
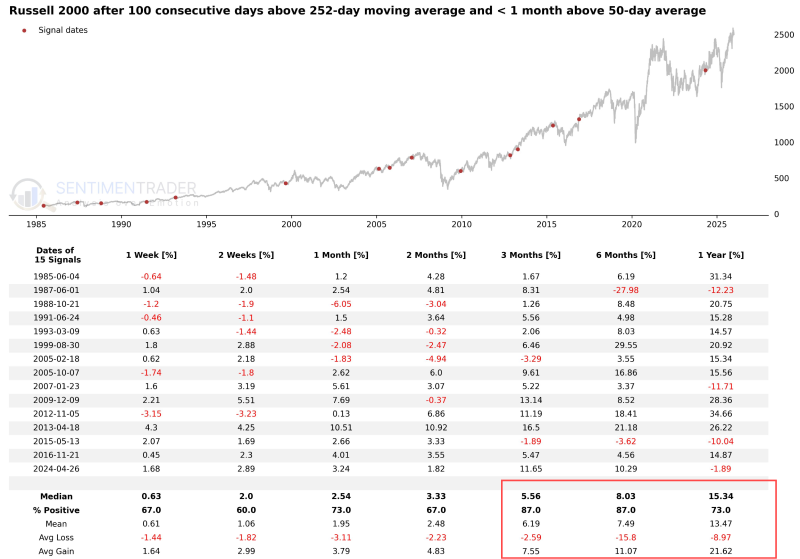
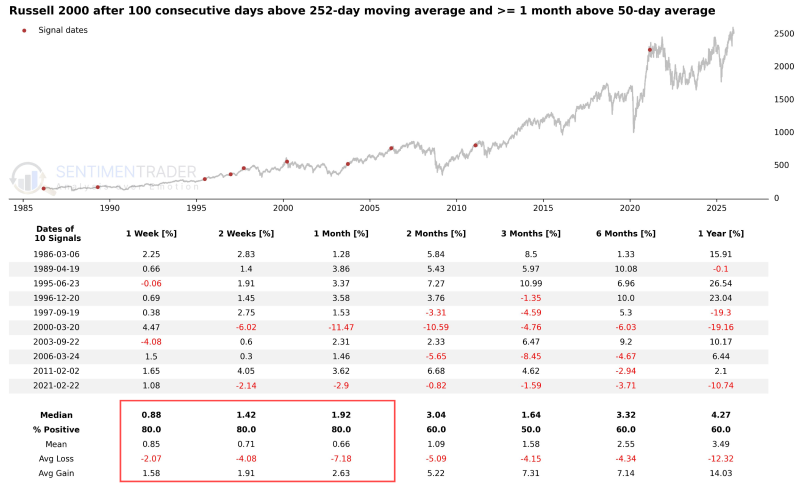
Moreover, the Russell 2000 Index had just broken above its 50-day moving average in the 21 trading days prior to the signal occurrence. The signals filtered in the table below only include instances where the Russell 2000 Index closed above the 252-day moving average for 100 consecutive trading days and above the 50-day moving average for at least one consecutive month. In such market conditions, the win rate is 80% within one month, nears a coin flip at the two-month mark, and the average losses and gains are nearly equal after one year.
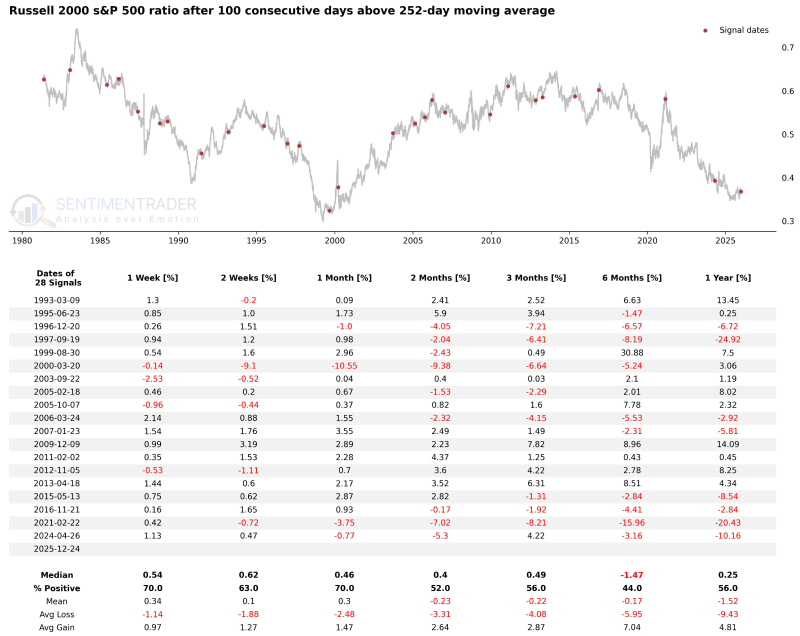
Investors are hopeful for a recovery in small-cap stocks, believing they finally have a chance to outperform the S&P 500 Index. This sentiment is hard not to resonate with, as small-caps have not demonstrated leadership for a long time.
However, these prolonged periods above the 252-day moving average are not a strong signal of relative recovery. Over the subsequent two to three months, the win rate of the Russell 2000 Index relative to the S&P 500 Index continues to decline, and after one year, the average loss is nearly twice the average gain.
A decile analysis based on the Russell 2000 Index's distance from its 252-day moving average reveals when we should be most concerned about its future returns.
The chart below displays the Russell Index's annualized returns based on the percentage deviation of the index from its average. We can identify three distinct zones: below -3.8% (oversold), above +5.4% (positive momentum), and the range in between (neutral zone).
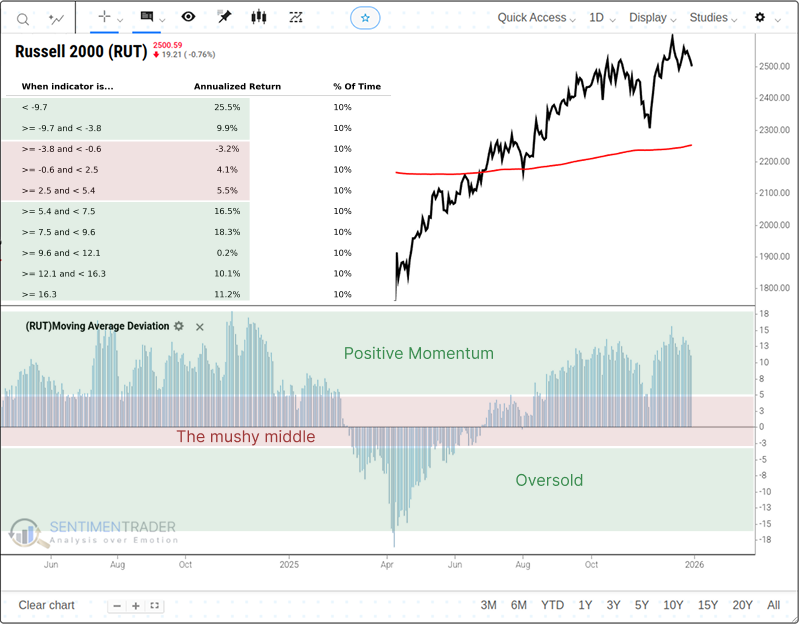
Even when the Russell Index is well above its 252-day moving average, positive returns are driven by a few sharp rallies, typically occurring as the market recovers from a prolonged bear market.
These returns indicate that the real danger for investors will come when the 252-day moving average catches up to the index, the trend flattens out, and upward momentum fades. At that point, the index will, at best, enter a prolonged period of sideways consolidation.
What the research tells us...
As demonstrated by this comprehensive backtest, the Russell 2000 Index holding above the 252-day moving average for 100 consecutive days is statistically a historically significant "bullish signal". However, in this noisy market, a single technical indicator is always just one piece of the puzzle, not the entire picture.
It is crucial to note that historical backtests are a summary of the past, not a promise for the future. The 45-year period covered by the above data differs significantly from the current macroeconomic environment.
Even if we see echoes of historical patterns in the charts, there is no guarantee that the market will follow the script exactly. Especially at a time when short-term momentum indicators are in a stalemate, any minor liquidity disruption could amplify irrational market volatility. After all, in the complex ecosystem of the stock market, besides price, the only certainty is uncertainty itself.