
Risk-On/Off indicator Ends 42-Day Streak Above 67

Key Points
- The Risk-On/Off indicator broke below the 67% threshold, ending a 42-day stretch of high risk appetite
- Historical data shows that when the indicator falls into the "transition zone" of 35%-67%, index-level trends tend to weaken, with the market more likely to trade sideways
- Long-term momentum remains intact
Pause in High Risk Appetite
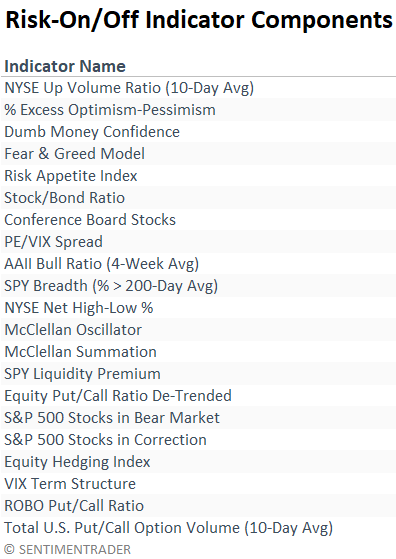
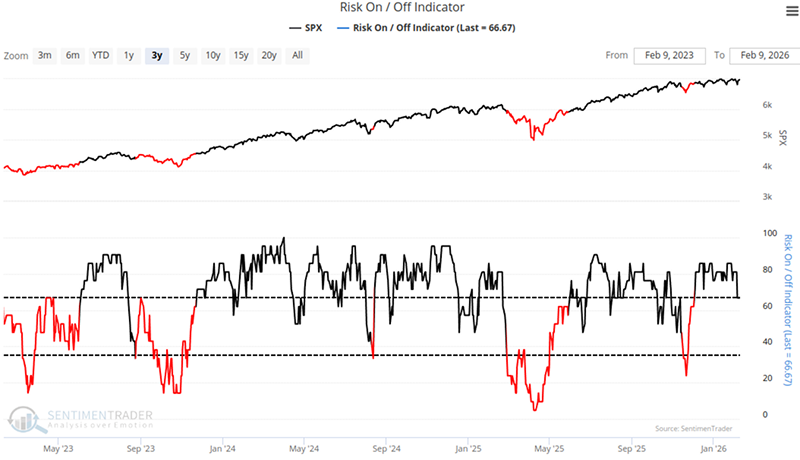
Since late 2025, the market has been in an extremely optimistic state. The Risk-On/Off indicator-a composite reading of 21 different sentiment and breadth metrics-had remained above the critical 67% threshold for 42 consecutive days.
This phenomenon typically signals a "tailwind period" for the market, characterized by elevated investor sentiment and a healthy internal market structure. However, this winning streak was broken on February 5, when the indicator fell back below 67%.
What Happens When the Indicator Breaks Below 67%?
By analyzing 114 historical cases, when the risk appetite indicator falls below 67%, the data showing similar signals is as follows.Related Backtest Click Here.
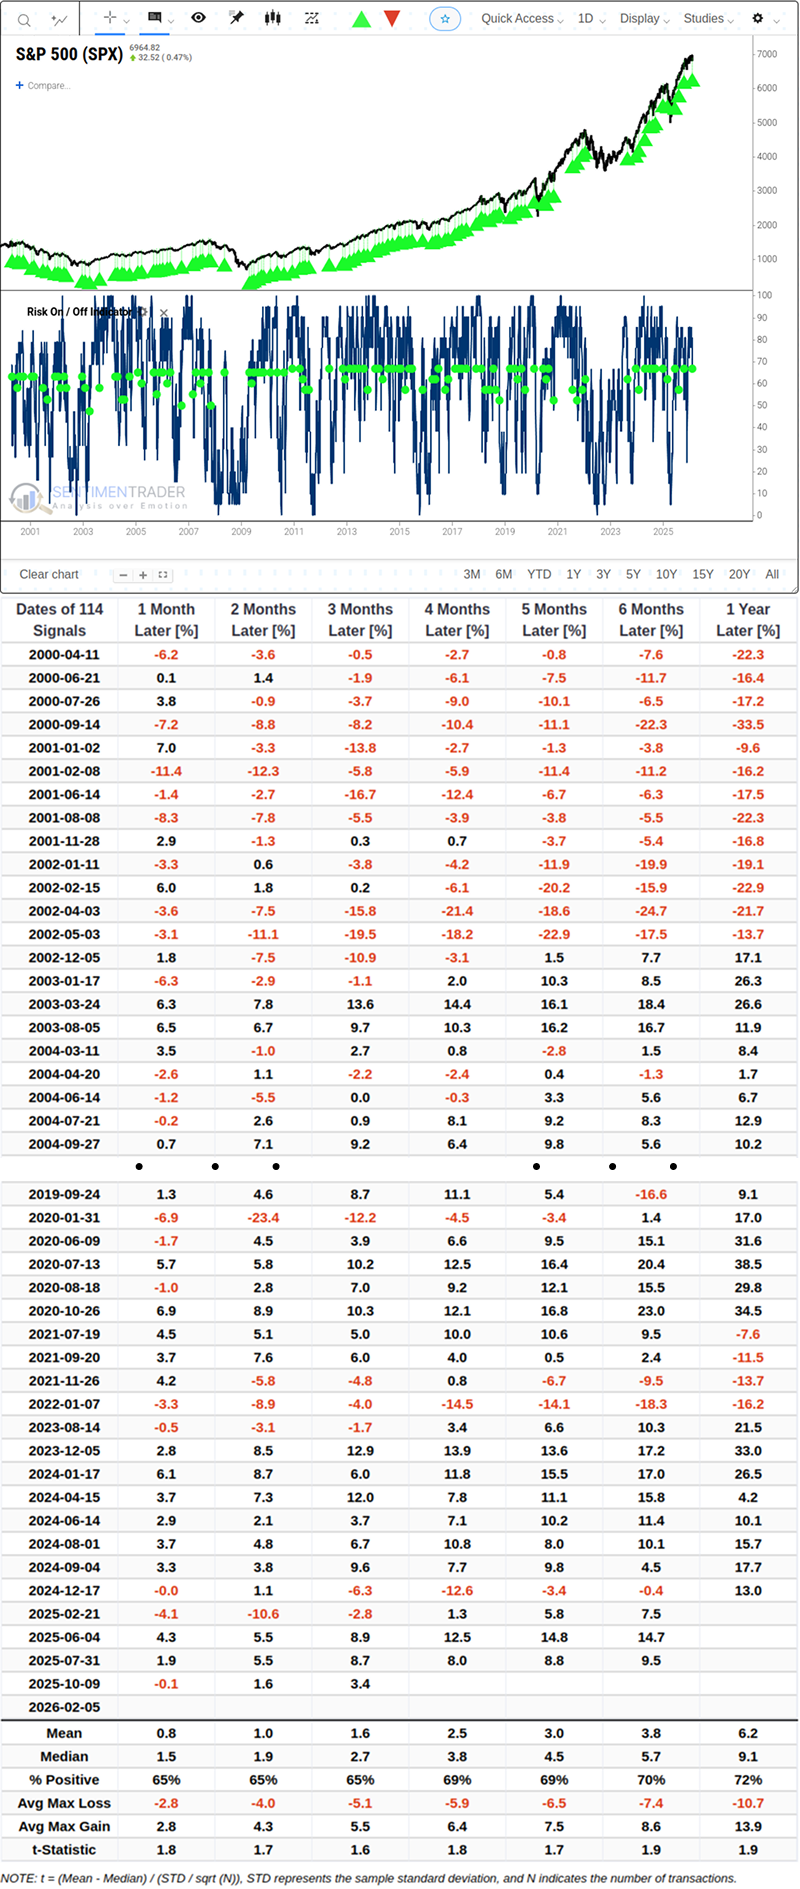
Data indicates that such signals often foreshadow short-term volatility. In the month following the signal trigger, the S&P 500 Index had a 65% probability of rising, with an average maximum drawdown of only -2.8%. This suggests that while a deep market crash is unlikely, the market typically needs to digest previous profit-taking through "time for space," and short-term trends may lack a clear direction.
What Does Entering the "Transition Zone" Mean?
To gain deeper insight into the impact of this shift, we examined asset performance curves across different risk zones. We categorize market conditions into three ranges: Comfort Zone (>67%), Transition Zone (35%-67%), and Panic Zone (<35%).
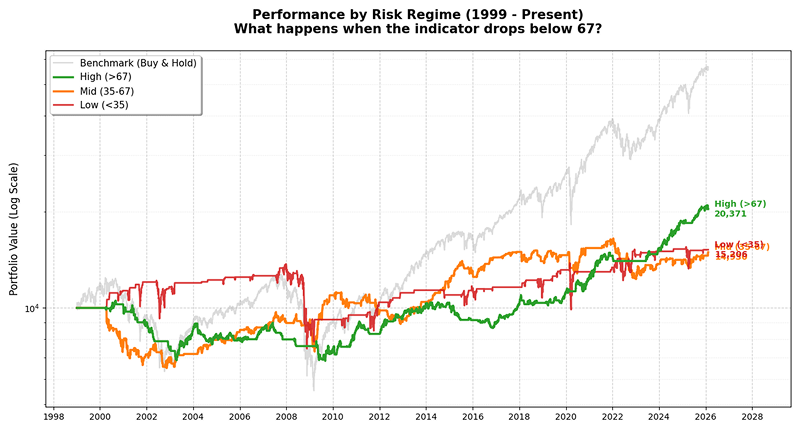
Looking at data from 1999 to the present-particularly during the cycles of alternating quantitative easing and tightening since 2014 (orange line in the chart)-we find that when the indicator is in the 35%-67% middle range, the cumulative return curve of the S&P 500 Index statistically flattens out.
This means that excluding days in extreme zones, the market tends to exhibit oscillatory characteristics of "one step forward, two steps back," and the efficiency of simple "buy-and-hold" strategies declines significantly in this specific range. The current break below 67% implies we may be exiting the "easy money" environment and entering a phase that requires more patience and refined operation.
Support from Long-Term Momentum
Despite short-term oscillatory risks, the long-term backdrop remains constructive. An important context for this signal is that the indicator had maintained elevated levels for over 42 days before breaking down. Such prolonged strength typically reflects strong underlying momentum.Related Backtest Click Here.
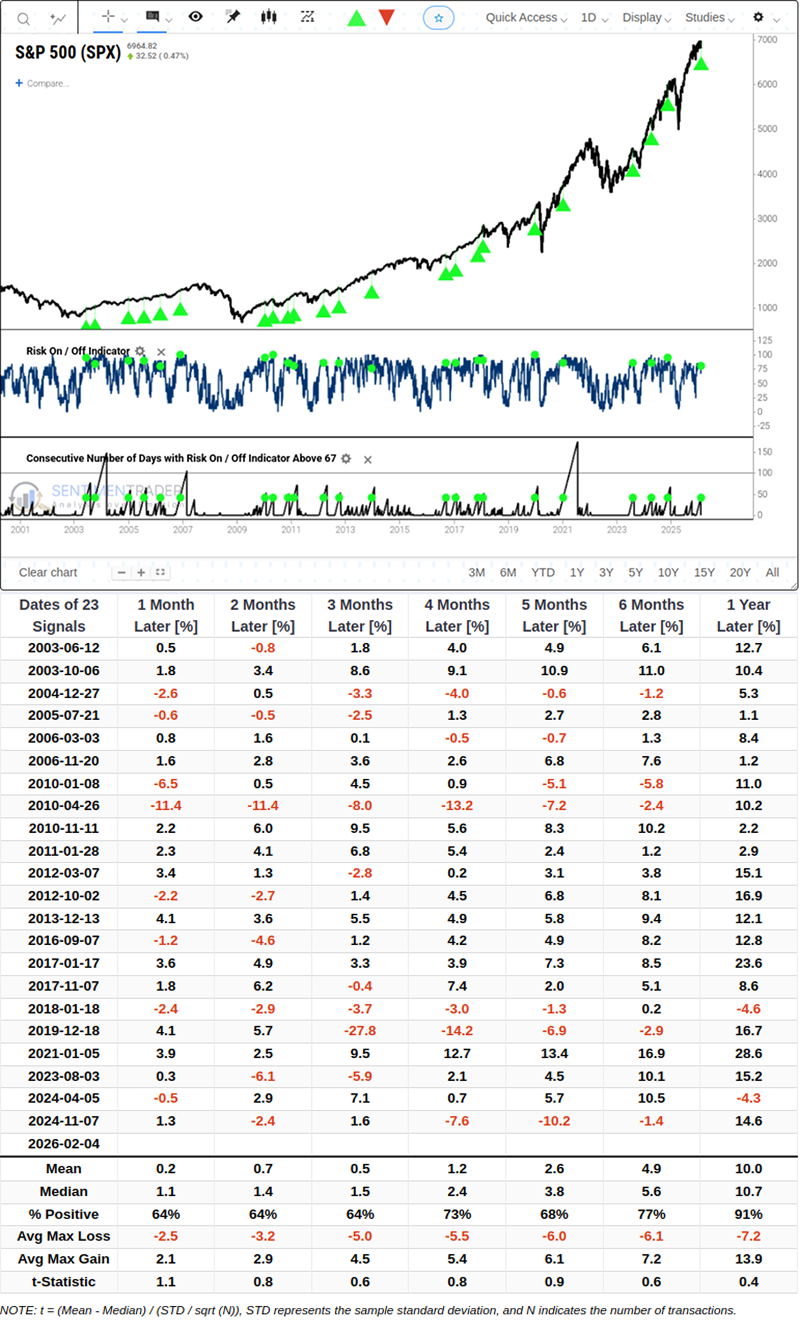
Historical data shows that there have been 22 instances where the Risk-On/Off indicator stayed above 67% for more than 42 consecutive days, and the S&P 500 Index performed strongly in the subsequent year. The average 1-year return was 10%, the median return was 10.7%, and the probability of positive returns was as high as 91%. While the sample size is relatively small, and we need to be wary of the 9% of extreme failure cases (e.g., sudden macroeconomic shifts), the high win rate suggests that barring major black swan events, the current correction is more likely a "halftime break" within an uptrend rather than a trend reversal.
When seeking opportunities amid volatility, historical data tends to favor offensive sectors. The chart below shows the performance of various sectors following the aforementioned signals.
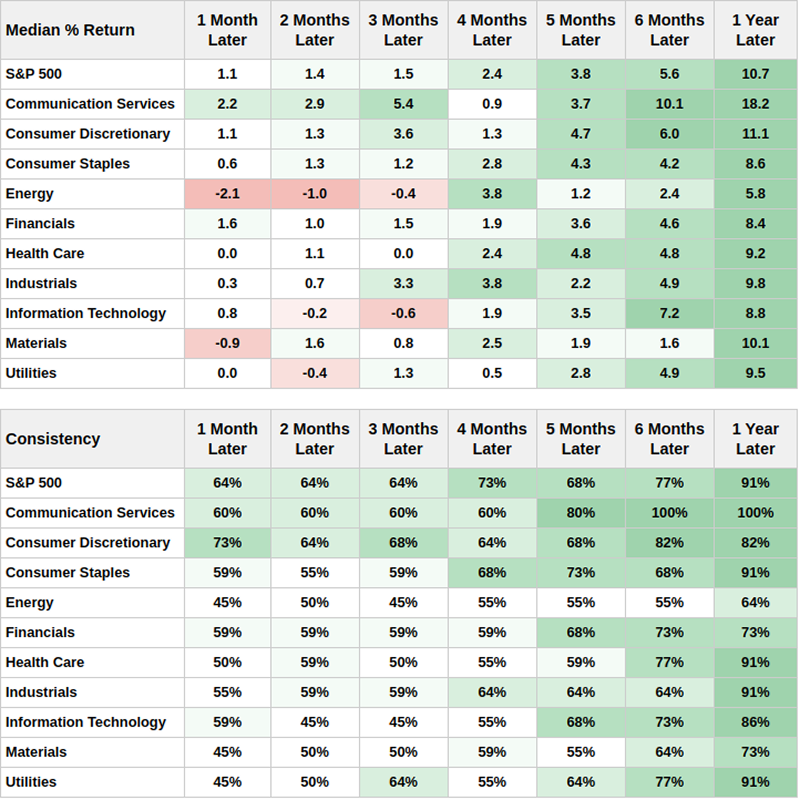
The discretionary consumption and technology sectors have performed notably well. In contrast, defensive or resource-related sectors such as Energy and Utilities underperformed relatively. This indicates that even as the market enters a consolidation phase, capital still tends to seek allocation opportunities in high-growth and high-beta industries.
What the Research Tells Us...
The Risk-On/Off indicator breaking below 67% is a notable microstructural shift in the market. It alerts investors that the "easy mode" of low volatility and unidirectional rallies seen over the past two months may be temporarily coming to an end. As the market enters the 35%-67% transition zone, historical experience tells us to lower expectations for short-term returns and prepare for potentially increased volatility.
However, given the strong prior market momentum and high win rate in historical data, the current evidence does not support a bearish outlook across the board. On the contrary, considering the historically shallow average drawdowns, the current volatility may present better entry points. During this phase, focusing on historically outperforming sectors such as Communication Services and Technology, and maintaining rationality when the market pulls back to support levels, may be a reasonable strategy to navigate the current "transition period."