
Risk appetite is waning despite stocks' rise

Key points:
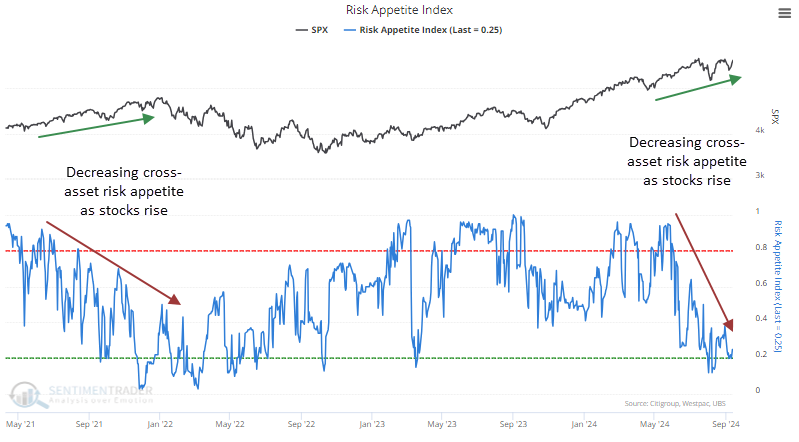
- The S&P 500 is tickling record highs, but cross-asset risk appetite remains exceptionally low
- We don't often see divergences like this, as stocks typically impact overall sentiment to an inordinate degree
- Other times risk appetite was abnormally low, stocks struggled except for defensive sectors like consumer staples and utilities
In other markets, investors aren't so sanguine
Momentum in stocks is back to being a compelling reason to stay invested. As we saw Monday, action like we've witnessed over the last two weeks has been a consistent precursor to further gains.
That doesn't mean everything agrees, and we'd be remiss not to mention some of the dangers at least. It's easy just to pick a direction, play see-no-evil, and hope for the best. It's much more difficult to weigh the evidence and adjust probabilities, hopefully resulting in a smoother ride over time.
In that vein, one curiosity that sticks out is the lack of risk appetite across markets. In stocks, optimism is objectively high (though not as extreme as it had been). It's in other markets where the curiosity lies:
- Credit spreads are wider than they typically are when the S&P 500 is a hair's breadth from a record high
- Currencies have been volatile
- Gold is soaring
- Defensive sectors are leading
All of those are signs of investors tapping the brakes. The last time the S&P was sitting near a high while cross-asset Risk Appetite was low was in late 2021. We know how that worked out.
Divergences are helpful but can be tricky beasts. Sometimes, they're simply useless; other times, they drag on for weeks, months, or even years before having an impact. All we can do is quantify similar behavior to what we're seeing now and see how that impacted returns to see if it might be worth adjusting expectations for anyone who utilizes a Bayesian approach to investing.
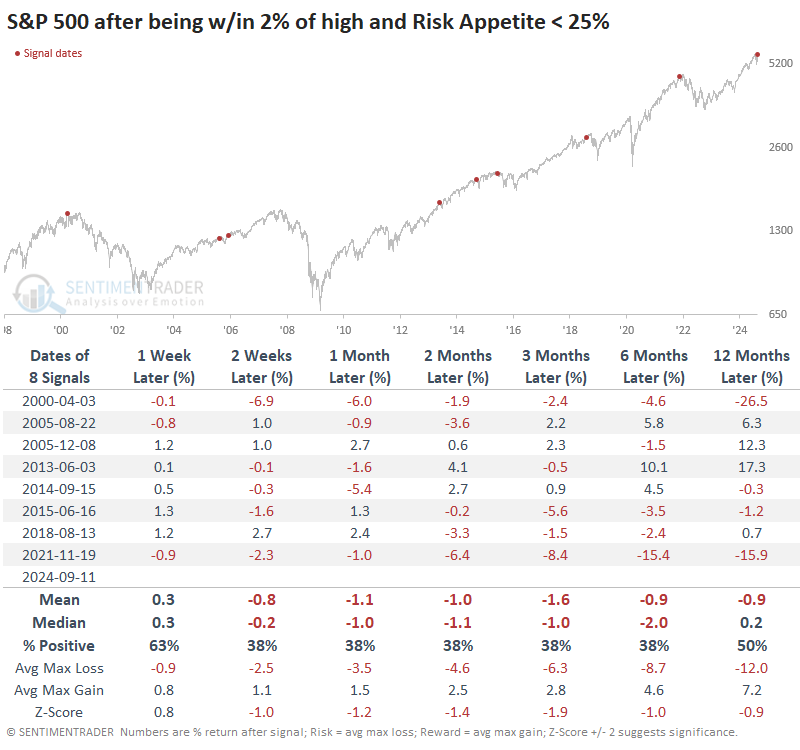
The table below shows every time the S&P was within 2% of a multi-year high and the Risk Appetite Index was 25% or below. The most notable aspect of the returns is that the index showed a loss at some point across the next 2-12 months every time. Usually, the losses were over the next few months, but stocks managed to rally over that time frame a few times...and then gave it all back.
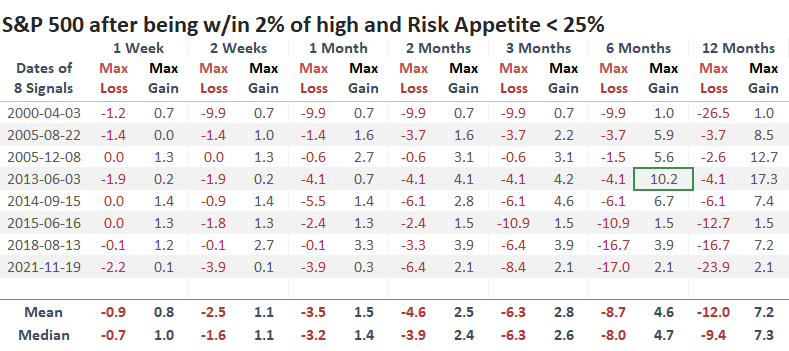
The table of maximum gains and losses across time frames shows that the last three signals all suffered a double-digit loss within the next six months, though before those signals, losses were muted. It was more consistent to see limited rallies - only one signal enjoyed more than a +10% gain within the next six months.
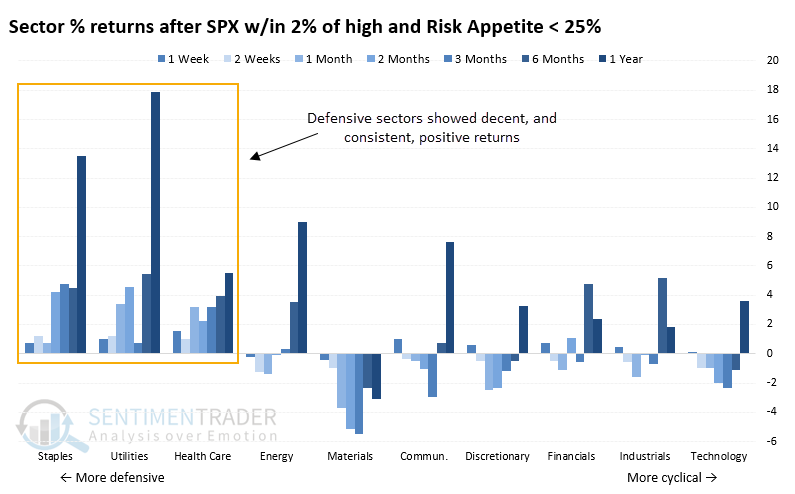
A bias toward defense
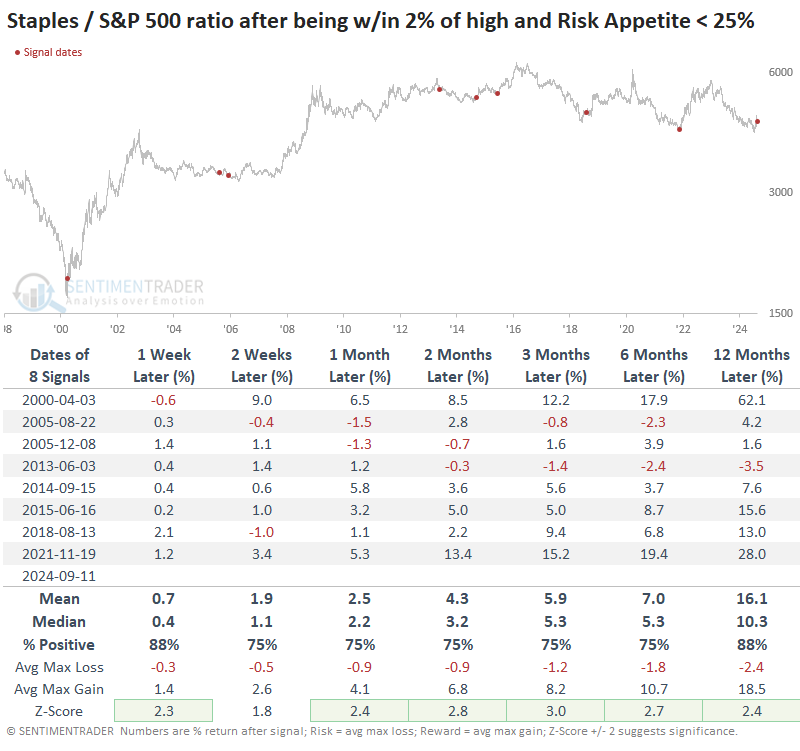
Among sectors and factors, there was a clear bias toward defensive groups. That factor showed a gain six months later 88% of the time versus only a 38% win rate for cyclical stocks. Staples and utilities rallied after every signal over the next year, both averaging more than +13%.
Below, we can see a ratio of consumer staples to the S&P 500 after these signals. Across almost all time frames, the ratio exhibited above-average returns and was consistently positive. The few times staples lost ground relative to the broader market, the losses were minimal and usually not persistent.
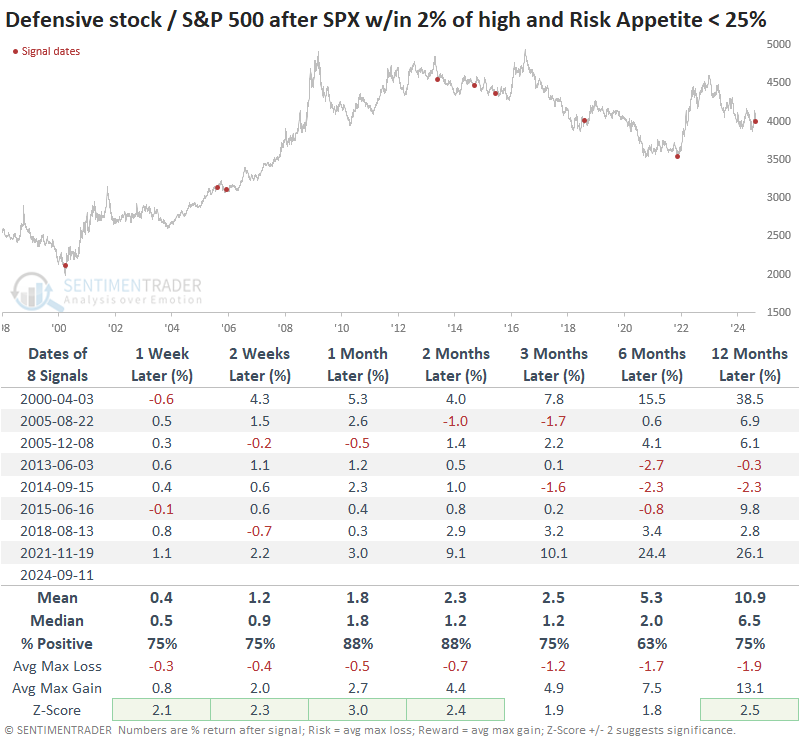
We see a similar dynamic using a broader index of defensive sectors (staples, utilities, and health care). A tilt toward these groups proved effective relative to the broader market across most time frames.
What the research tells us...
Look, it's frustrating to read something bullish one day and then bearish the next day. I get it. I also don't believe in ignoring disconfirming evidence if it's compelling.
There is absolutely something to the idea that most investors are trend-followers and suffer FOMO when they see people brag about gains after a week like last week. That's a valid reason to expect gains to continue, and there isn't enough (in my opinion) in the lack of risk appetite across markets to completely counter the bullish arguments. It is enough to perhaps temper expectations, though. More than anything, it's further evidence that defensive sectors may perform relatively well if those "other market" concerns pan out.