Products
SentimenTrader Trading Tools
‍
Backtest Engine
My Trading Toolkit
Correlation Analysis
Seasonality
Market Prediction
Indicators & Data API
‍
Proprietary Indicators & Charts
Market Data API
Strategies & Scanner
‍
50+ Trading Strategies
Smart Stock Scanner
Smart Option Scanner
Research Reports
‍
Research Solutions
Reports Library
Free Resources
Simple Backtest Calculator
Simple Seasonality Calculator
The Kelly Criterion Calculator
Sentiment Geo Map
Public Research Reports
Education
Sentiment Indicators
Technical Indicators
Pricing
Company
About
In the News
Testimonials
Client Success Stories
Contact
Log inLoginSign up
< BACK TO ALL REPORTS

Risk Appetite Index suggests higher stock prices

Jay Kaeppel
2022-01-07
The Risk Appetite Index can give essential clues when it reaches - and reverses from - extreme levels. This piece looks at three different methods for using this key sentiment index to highlight potentially favorable periods for stock investors.

Key Points

  • Our Risk Appetite Index fell to a deeply oversold level in late November
  • It has since reversed back to the upside
  • Both of these occurrences suggest higher stock prices in the months ahead

The Risk Appetite Index

A handful of firms have introduced various measures of investors' risk appetite. We combined three of them and normalized them into a single index called the Risk Appetite Index. As the index rises, investors are becoming more and more risk-seeking. As the index falls, investors are becoming more and more risk-averse. 

The Risk Appetite Index is a contrarian indicator, i.e., excessive optimism should lead to poorer-than-average future market returns. Conversely, extreme pessimism should lead to better-than-average future market performance. 

There are various ways that the Risk Appetite Index can alert investors to favorable market conditions. Let's look at three.

#1. An early alert signal

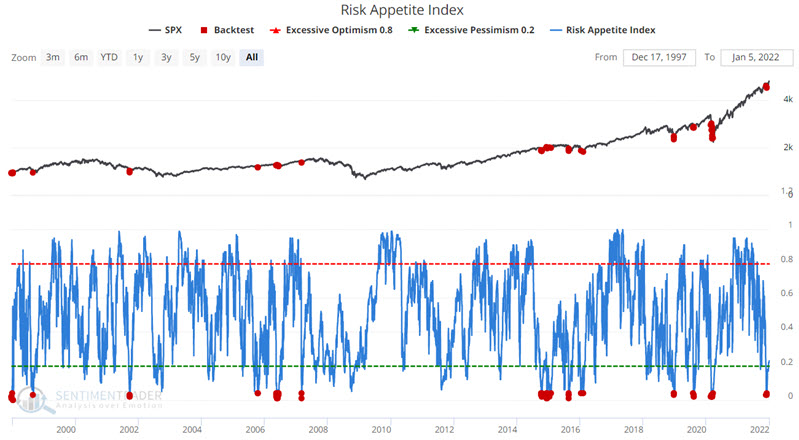
Our first look identifies when the Risk Appetite Index is below 0.05. This can be tested in the Backtest Engine. The chart below displays the signal dates.Risk Appetite Index suggests higher stock prices
The table below displays performance results.

Risk Appetite Index suggests higher stock prices

Results have been solidly bullish, with three months showing a 100% Win Rate.

#2. An even more extreme alert signal

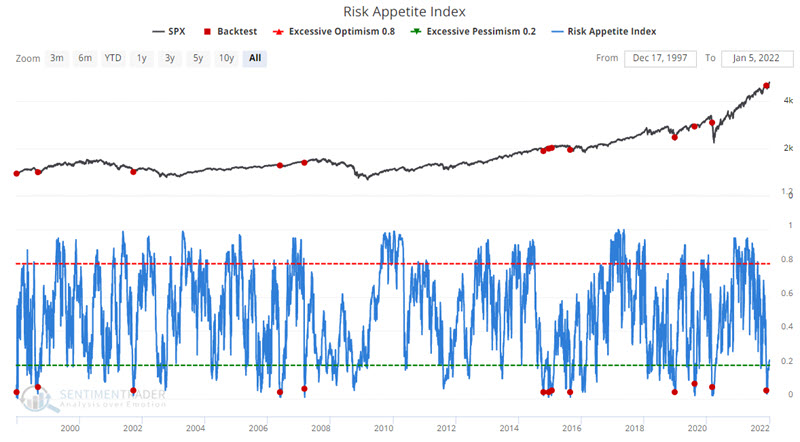
Our second look identifies when the Risk Appetite Index drops below and then crosses back above an even more extreme level of 0.03 for the first time in a month. This can be tested in the Backtest Engine. The chart below displays the signal dates.
Risk Appetite Index suggests higher stock prices

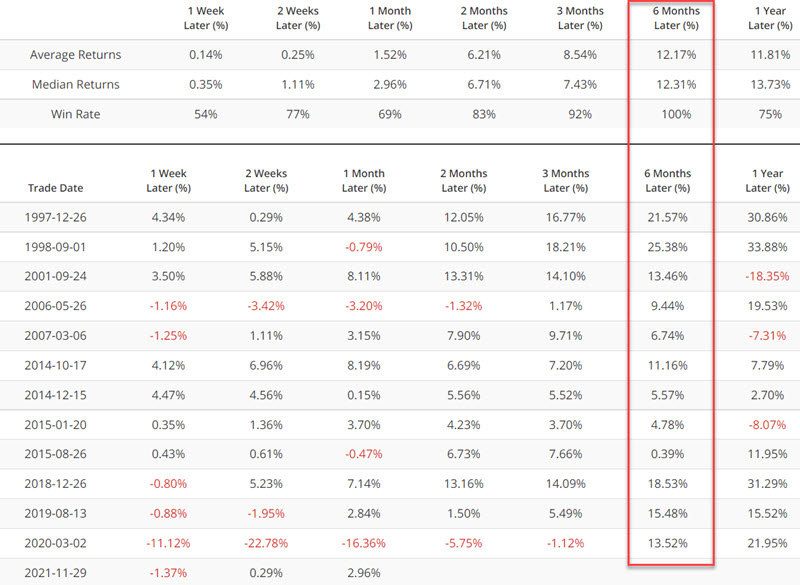
The table below displays performance results.
Risk Appetite Index suggests higher stock prices

The 6-month time frame has seen the S&P 500 Index gain ground in all 12 prior instances.

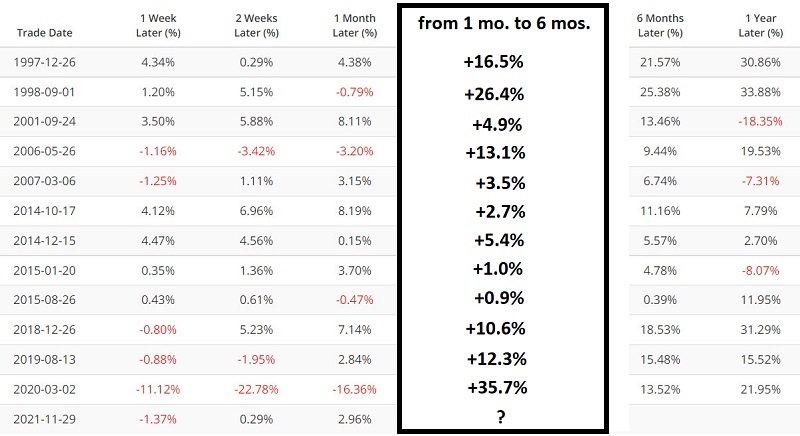
The latest signal was generated just over a month ago, on 11/29/2021). The table below shows that the S&P 500 gained ground between the end of the first month and the end of the 6th month in all previous cases. The median return for this five-month period has been +8.0%. While some of the gains were small, the main point is that there were no major selloffs. This suggests continuing to give the bullish case the benefit of the doubt. 
Risk Appetite Index suggests higher stock prices

#3. A confirmation signal

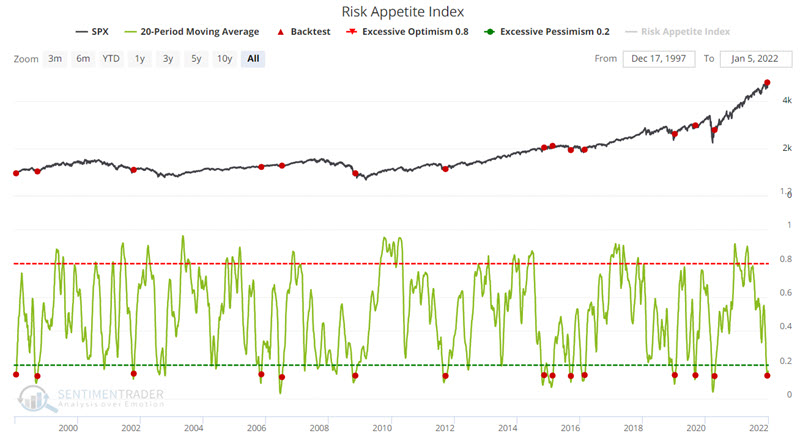
Our third look uses one of Jason's backtests and identifies when the 20-day moving average for the Risk Appetite Index crosses back above 0.13. This can be tested in the Backtest Engine. The chart below displays the signal dates.Risk Appetite Index suggests higher stock prices
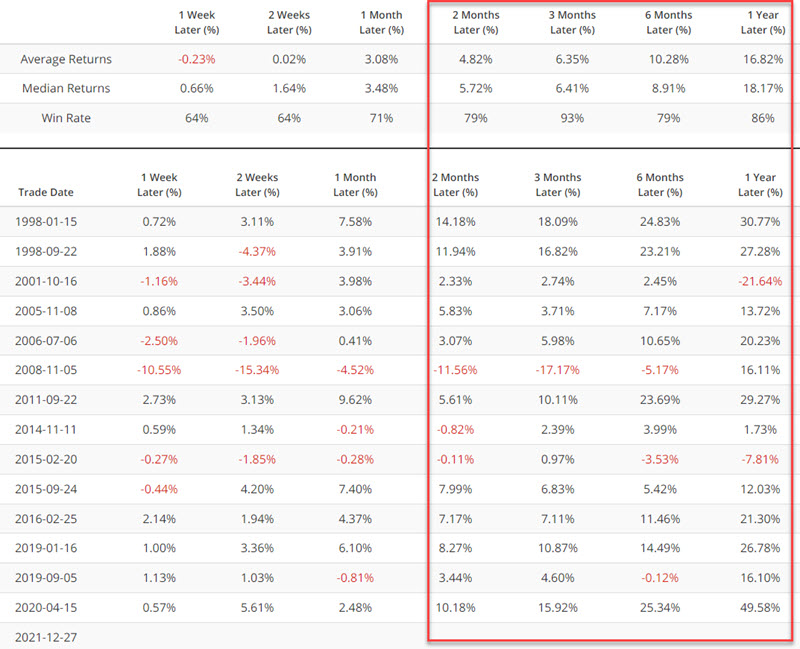
The table below displays performance results.
Risk Appetite Index suggests higher stock prices

What the research tells us:

Robust indicators can often be used in more than one way. This piece highlighted that the Risk Appetite Index can be useful as an early warning system, a timely trade trigger, and a solid confirming indicator. The oversold level reached in late November, the reversal in early December, and the confirmation signal in late December all lend weight to the bullish case for stocks in the months directly ahead.

PRODUCTS
SentimenTrader
Trading Tools
Indicators & Data API
‍
Strategies & Scanner
‍
Research Reports
FREE
RESOUrCES
Simple Backtest
Calculator
Simple Seasonality
Calculator
The Kelly Criterion
Calculator
Sentiment Geo Map
‍
Public Research Reports
‍
Education
Sentiment Indicators
‍
Technical Indicators
‍
Pricing
Bundle pricing
‍
FAQ
‍
Announcements
‍
COMPANY
‍
About
‍
In the News
‍
Testimonials
‍
Client Success Stories
CONTACT
‍
General Inquiries
‍
Media Inquiries
‍
Financial Professionals Inquiries
‍
© 2026 Sundial Capital Research Inc. All rights reserved.
Setsail Marketing
TermsPrivacyAffiliate Program
Risk Disclosure: The information and tools provided are for research and analytical purposes only and are not intended as investment advice. Market analysis involves uncertainty, and outcomes may differ from expectations. Users should conduct their own due diligence and consider their individual circumstances before making any financial decisions. Past performance is not necessarily indicative of future results.

Hypothetical Performance Disclosure: Hypothetical performance results have many inherent limitations, some of which are described below. No representation is being made that any account will or is likely to achieve profits or losses similar to those shown; in fact, there are frequently sharp differences between hypothetical performance results and the actual results subsequently achieved by any particular trading program. One of the limitations of hypothetical performance results is that they are generally prepared with the benefit of hindsight. In addition, hypothetical trading does not involve financial risk, and no hypothetical trading record can completely account for the impact of financial risk of actual trading. for example, the ability to withstand losses or to adhere to a particular trading program in spite of trading losses are material points which can also adversely affect actual trading results. There are numerous other factors related to the markets in general or to the implementation of any specific trading program which cannot be fully accounted for in the preparation of hypothetical performance results and all which can adversely affect trading results.

Testimonial Disclosure: Testimonials appearing on this website may not be representative of other clients or customers and is not a guarantee of future performance or success.