
Rising sector trends add weight to the bullish case

Key points
- Not every indicator acts as a trading system - most merely add a certain amount of weight to the bullish or bearish case
- Some indicators typically occur before the market turns, while others are most useful as "confirmation" that a turn has already taken place
- The Major Sector % Rising 200-day indicator just gave a confirmation signal
The Major Sector % Rising 200-day indicator as a confirmation tool
This indicator shows the percentage of 11 major sectors with a rising 200-day moving average. It includes technology, energy, financials, health care, utilities, consumer discretionary, consumer staples, industrials, communications, materials, and real estate.
Typically, a rising 200-day moving average confirms that a given security or sector is in an established rising trend. When looking at sectors, this indicator can be used in two ways:
- When the 50-period average rises above 40%, it (typically) suggests that a new uptrend has been established following a previous market decline
- When the 50-period average rises above 70%, it (typically) confirms that a bull market is in force
A cross above 40% often indicates that the worst is over
The chart below displays a "red dot" when the 50-day moving average of the Major Sector % Rising 200-Day indicator crossed above 40%.
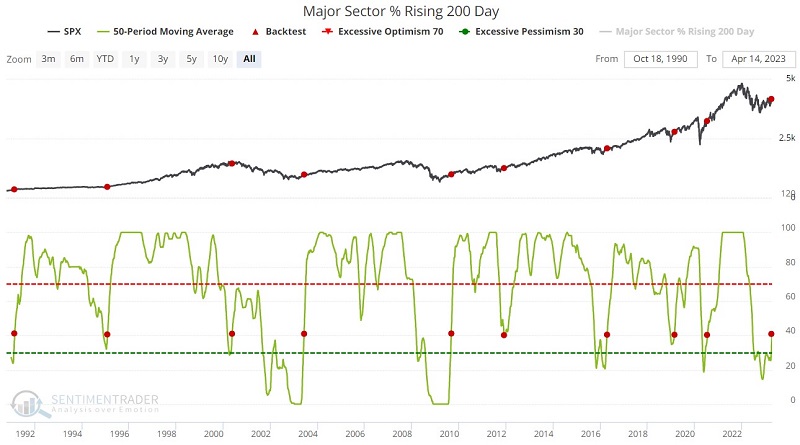
The table below summarizes subsequent S&P 500 performance.
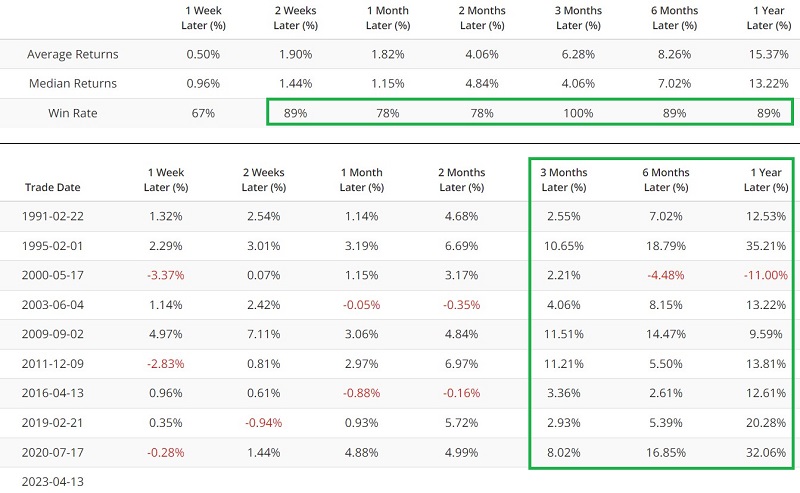
Like most indicators, this one is not infallible. A significant bear market followed the May 2000 signal. Nevertheless, all other signals saw the S&P 500 higher six and twelve months later. And even the May 2000 signal showed a gain three months after the signal.
The most recent favorable signal occurred on 2023-04-13.
A cross above 70% often indicates a new bull market is established
The chart below displays a "red dot" when the 50-day moving average of the Major Sector % Rising 200-Day indicator crosses above 70%, including overlapping signals.
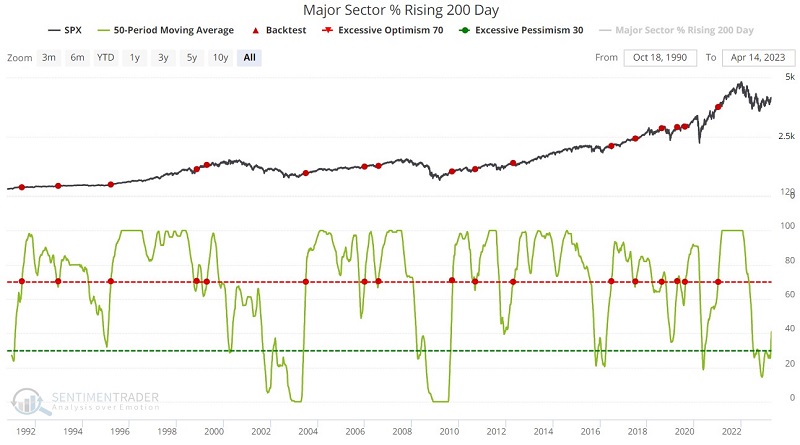
The table below summarizes subsequent S&P 500 performance.
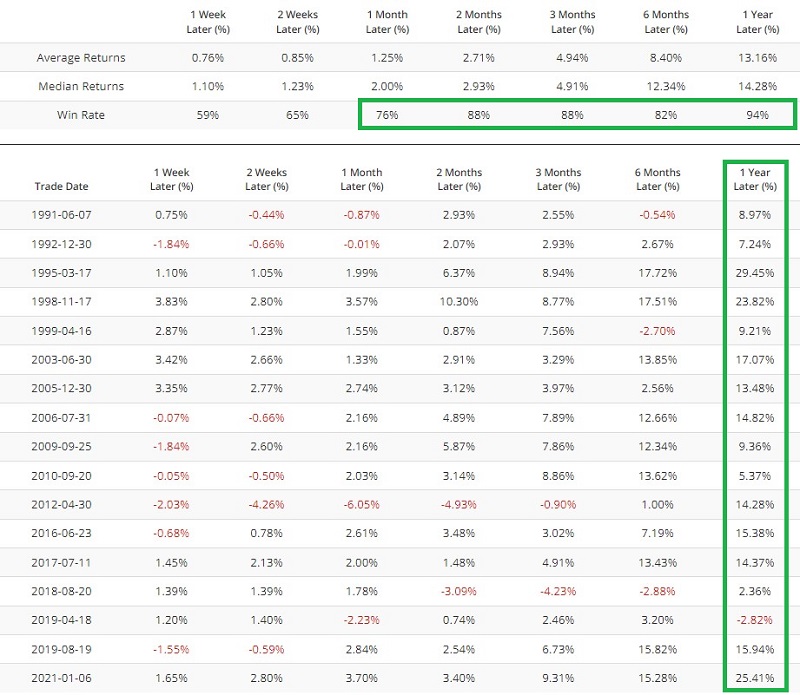
A new favorable signal will occur if and when the green line in the chart above crosses above 70%.
What the research tells us…
Individual indicators never guarantee anything. They can, however, lend significant weight to the bullish or bearish case. In the case of this indicator, there is a long history of correctly highlighting when the worst is over following a bear market and when investors can anticipate extended gains with the establishment of a new bullish trend. There is no way to know if the most recent cross above 40% will end up as a "dud" ala May of 2000. But for now, history suggests that a favorable trend may be forming under the noses of many investors.