Products
SentimenTrader Trading Tools
‍
Backtest Engine
My Trading Toolkit
Correlation Analysis
Seasonality
Market Prediction
Indicators & Data API
‍
Proprietary Indicators & Charts
Market Data API
Strategies & Scanner
‍
50+ Trading Strategies
Smart Stock Scanner
Smart Option Scanner
Research Reports
‍
Research Solutions
Reports Library
Free Resources
Simple Backtest Calculator
Simple Seasonality Calculator
The Kelly Criterion Calculator
Sentiment Geo Map
Public Research Reports
Education
Sentiment Indicators
Technical Indicators
Pricing
Company
About
In the News
Testimonials
Client Success Stories
Contact
Log inLoginSign up
< BACK TO ALL REPORTS

Ring out the old with real estate

Jay Kaeppel
2023-12-19
The last five trading days of the year have historically tended to be favorable for stocks. As it turns out, some stocks more than others. Take real estate for example.

Key Points

  • The last five trading days of the year have tended to be favorable for stocks
  • One sector that has stood out particularly is the real estate sector
  • For 2023, this period extends from the close on 2023-12-21 through the close on 2023-12-29

The last five trading days of December

The table below displays performance stats for each of the major S&P 500 sectors and factors ONLY during the last five trading days of every year starting in 1926.

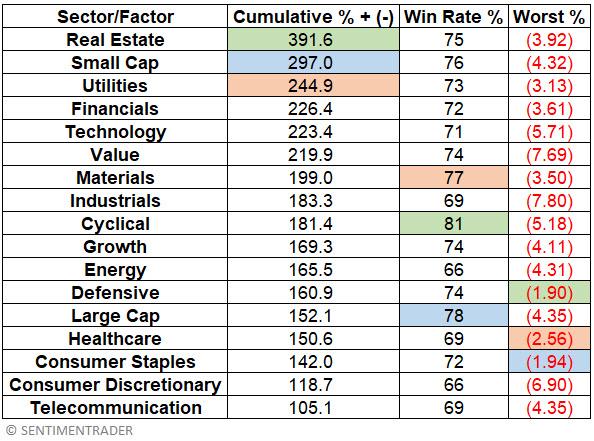
The results are ranked by cumulative growth. The results also show Win Rate % (i.e., the percentage of years when a sector/factor showed a gain during the last five trading days of the year) and Worst % (i.e., the worst single year-end performance). The top performer in each category is highlighted in green, the second best in blue, and the third best in orange.

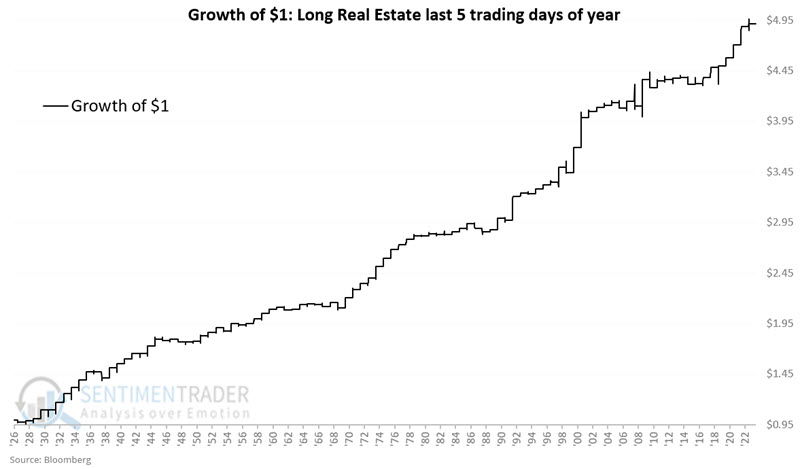
The chart below displays the growth of $1 invested in the Real Estate sector only during the last five trading days of the year every year since 1926.

The table below summarizes year-end Real Estate sector performance.

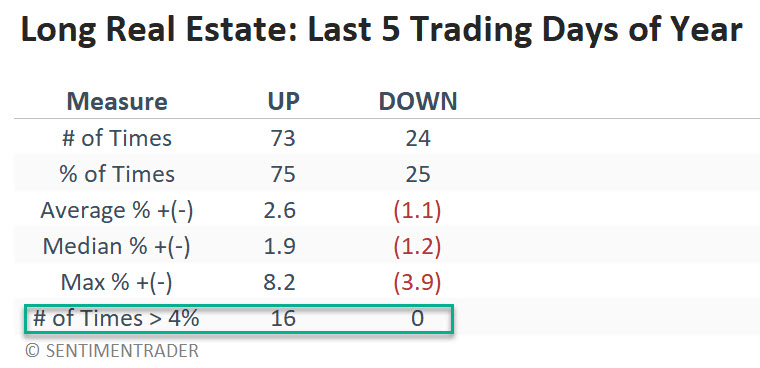
If we look at 5-year rolling returns, over 96% of 5-year periods saw the real estate sector register a net gain during this favorable window.

Real-world trading applications

There are several choices for a speculative trader wishing to play this seasonal trend. We will focus on two: 

  • iShares U.S. Real Estate ETF (IYR)
  • Direxion Daily Real Estate Bull 3X Shares (DRN)

Ticker IYR is the most heavily traded real estate ETF. It tracks the Dow Jones U.S. Real Estate Index, which is slightly different from the S&P 500 Real Estate Index (though trades with a roughly 99% correlation). Ticker DRN is designed to track the daily return for the S&P 500 Real Estate Index x 3.

Triple-leverage ETFs are extremely risky for obvious reasons. However, for those willing to assume the risks they are well-suited for short trading windows such as the one discussed here.

The chart below displays the growth of $1 in IYR during the last five days of the year since it started trading in 2000.

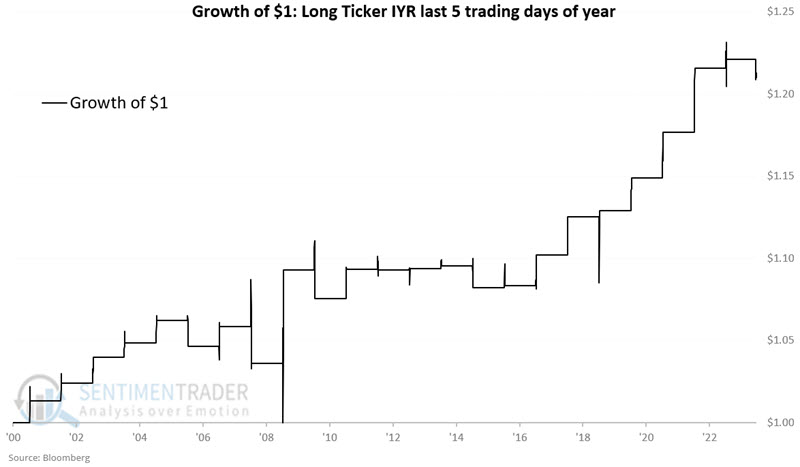
Since its inception, during the seasonal window, IYR has had a 78% win rate, an average annual gain of +0.89%, and a median gain of +1.08%. The worst performance was a loss of -2.1% in 2007.

The chart below displays the growth of $1 in DRN during the last five days of the year since it started trading in 2009.

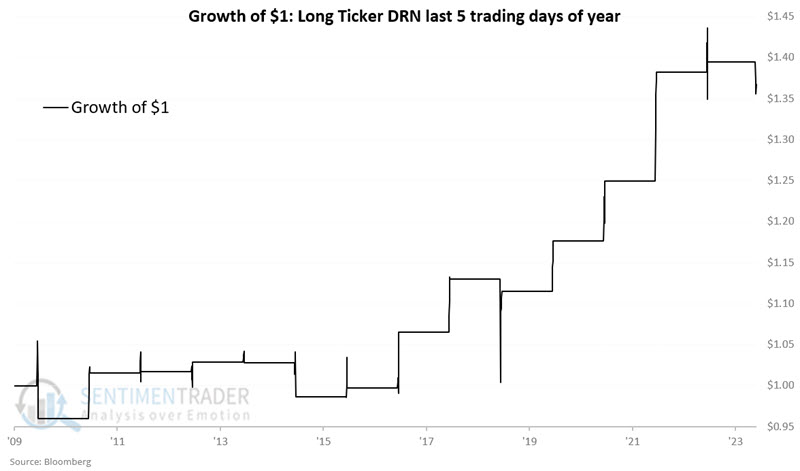
Since its inception, during the seasonal window, DRN has had a 71% win rate, an average annual gain of +2.49%, and a median gain of +1.09%. The worst performance was a loss of -4.0% in 2009 and 2014.

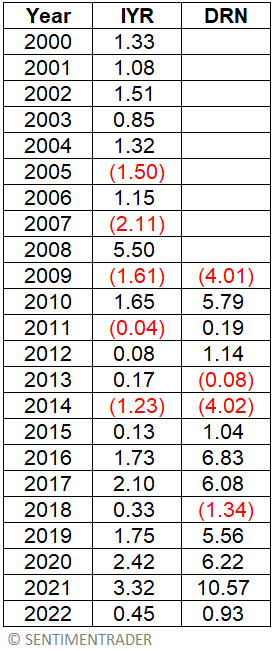
The table below displays the year-by-year performance of IYR and DRN during the last five trading days of the year.

What the research tells us…

Will the real estate sector register a gain during the last five trading days of 2023? Unfortunately, there is no way to predict. The odds are in this sector's favor if history proves an accurate guide. Historically, 3 of 4 years have shown a gain, and the losing periods have been reasonably manageable. The real questions for traders are "Is it worth committing capital to a somewhat arcane idea?" and "To leverage or not to leverage?" These are questions each trader must answer for themselves. 

PRODUCTS
SentimenTrader
Trading Tools
Indicators & Data API
‍
Strategies & Scanner
‍
Research Reports
FREE
RESOUrCES
Simple Backtest
Calculator
Simple Seasonality
Calculator
The Kelly Criterion
Calculator
Sentiment Geo Map
‍
Public Research Reports
‍
Education
Sentiment Indicators
‍
Technical Indicators
‍
Pricing
Bundle pricing
‍
FAQ
‍
Announcements
‍
COMPANY
‍
About
‍
In the News
‍
Testimonials
‍
Client Success Stories
CONTACT
‍
General Inquiries
‍
Media Inquiries
‍
Financial Professionals Inquiries
‍
© 2026 Sundial Capital Research Inc. All rights reserved.
Setsail Marketing
TermsPrivacyAffiliate Program
Risk Disclosure: The information and tools provided are for research and analytical purposes only and are not intended as investment advice. Market analysis involves uncertainty, and outcomes may differ from expectations. Users should conduct their own due diligence and consider their individual circumstances before making any financial decisions. Past performance is not necessarily indicative of future results.

Hypothetical Performance Disclosure: Hypothetical performance results have many inherent limitations, some of which are described below. No representation is being made that any account will or is likely to achieve profits or losses similar to those shown; in fact, there are frequently sharp differences between hypothetical performance results and the actual results subsequently achieved by any particular trading program. One of the limitations of hypothetical performance results is that they are generally prepared with the benefit of hindsight. In addition, hypothetical trading does not involve financial risk, and no hypothetical trading record can completely account for the impact of financial risk of actual trading. for example, the ability to withstand losses or to adhere to a particular trading program in spite of trading losses are material points which can also adversely affect actual trading results. There are numerous other factors related to the markets in general or to the implementation of any specific trading program which cannot be fully accounted for in the preparation of hypothetical performance results and all which can adversely affect trading results.

Testimonial Disclosure: Testimonials appearing on this website may not be representative of other clients or customers and is not a guarantee of future performance or success.